The debate on the future of the EU is likely to gain prominence in 2017, and a key issue will be the reform of the budget of the EU. In order to inform this debate, in this column we present an assessment of the redistributive1 function of the EU budget, based on a comprehensive dataset of actual expenditures and contributions per country, across 15 years (2000-2014).
Scale of redistribution of the EU budget redistribute
The EU budget accounts for roughly 1% of the EU's GDP. Around 80% of it, on average, returns back to each country in the form of various allocated expenditures, and only a limited part is actually redistributed among countries. On average over the past 15 years, the redistribution operated by the budget at the level of the EU was equal to 0.2% of the Union's GDP. As a matter of comparison, the average yearly cross-border flows operated through the federal budget in the US between 1980-2005 was equal to 1.5% of GDP (d'Apice 2015).
The amount of cross-border flows operated through the EU budget, however, has increased over time, reaching 0.3% of GDP in the recent years – as an effect of the first multiannual financial framework (2007-2013) established after the 2004 enlargement.
How progressive is this redistribution?
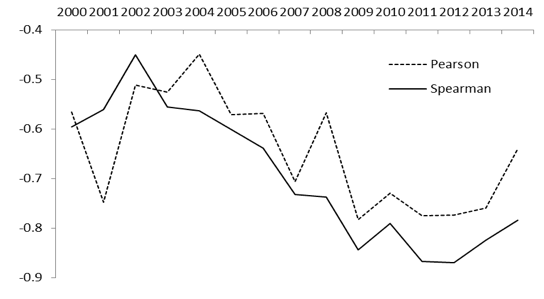
Our dataset covers a 15-year period, from 2000 to 2014, and allows for a calculation of the so-called net operating balance2 for each country, each year. The coefficient of correlation between the per capita net operating balance and the levels of income per capita indicates that this relation has a certain degree of progressivity, i.e. countries with lower income per capita tend to receive more. The linear regressions3 show that the relationship becomes stronger from 2004 onwards, which reflects the enlargement by ten new member states, whose relative income was lower than those already in, but this trend towards more progressivity has stopped in the most recent years.
Figure 1. Evolution of correlations, GDP per capita and operating budget balance per capita
Source: own elaboration on Eurostat and DG Budget data.
The overall redistributive impact of the EU budget
We try to look beyond the accounting of how much the budget redistributes, and measure its net impact. Following Feyrer and Sacerdote (2013), we estimate two equations to disentangle the redistributive effects of the revenue side and the expenditure side of the budget.
Both expenditures and revenues of the EU budget are significantly related to per capita income levels, although with small coefficients. In particular, for every €1,000 difference in levels of income per capita, €8.5 is offset by lower contributions paid to the common budget, and €2.7 is offset by higher expenditures paid by the budget. Overall the EU budget offsets only €11, i.e. an equalising effect of 1.1% (Pasimeni and Riso 2016). As a matter of comparison, Feyrer and Sacerdote (2013) find that in the US the equalising effect of the federal budget is 40%, or thirty-five times higher.
The specific contribution of each component
Our dataset allows for a greater level of detail in this analysis, by decomposing this overall effect into the different categories of expenditures and revenues. The expenditure side of the budget is composed of headings,4 and the revenue side can be decomposed into two broad categories:5 traditional own resources and national contributions.6
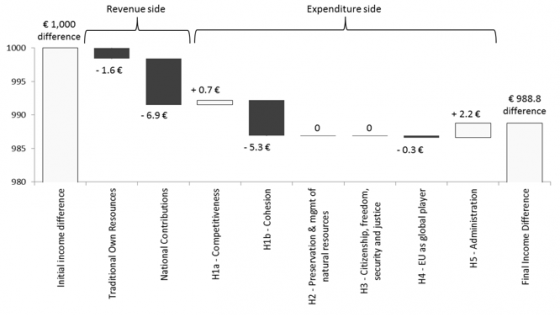
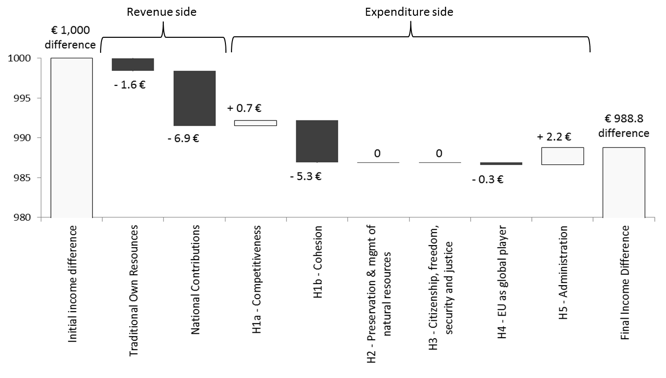
We estimate a set of parallel equations for each side of the budget, disentangling the specific contribution of each of them to the overall redistributive effect of the budget. Figure 2 shows the redistributive effect of each component per each €1,000 difference in levels of income per capita (Pasimeni and Riso 2016).
Figure 2. Decomposition of the net redistributive impact of the EU budget
Source: own elaboration.
Note: Figures are expressed in euros per capita, per each €1,000 difference in levels of income per capita. Expenditures are composed by the five headings.7 National contribution (based on GNI and VAT) plus other own resources compose the total revenues. The panel is composed of annual data per country per year from 2000 to 2014.
The main source of redistribution comes from the revenue side and is the national contribution. This is quite consistent with the notion that the contribution based on GNI and VAT is the most related to income levels. On the expenditure side, the main contribution to redistribution comes from cohesion policy, as one would expect, although to a lesser extent than the national contribution. Still on the expenditure side, the largest item of the budget, Heading 2, has no significant redistributive impact in terms of equalisation of income levels across countries. This is probably due to its function as a cross-sectoral redistributive instrument. Finally, some categories of expenditures, such as those for competitiveness and administration, have a negative (although small) redistributive impact, partially offsetting the positive impacts of the other components.
The responsive is the budget to changes in economic conditions
We focus the analysis on changes, rather than levels, of revenues and expenditures per capita of the EU budget, and test how they are related to simultaneous changes in income per capita across time.
The EU budget in general is not very responsive to changes in income. Changes in expenditures per capita are not at all significantly correlated with changes in income per capita – only changes in contributions are. A €1,000 fall in per capita income determines a €8.3 reduction in the per capita contribution by a country to the budget (Pasimeni and Riso 2016). As a matter of comparison, the same reduction in taxes paid by states to the federal budget in the US, associated with a $1,000 reduction in income per capita, is $253, or thirty times higher (Feyrer and Sacerdote 2013).
When assessing separately the responsiveness of each of the two sources of revenues, we observe that both are significantly associated to changes in income per capita, and the above-mentioned €8.3 reduction in per capita contribution is composed of a €6.6 reduction of the ‘national contribution’ and a €1.7 reduction in the ‘traditional own resources’ per capita, across the EU. This confirms the intuition that the national contribution, being based on GNI and on VAT, is more responsive to cyclical conditions than traditional own resources, and is the single most responsive component of the whole budget.
Net impact of correction mechanisms on the redistributive capacity
The EU budget has a number of correction mechanisms granted to some member states. The first was introduced in 1985 to correct the imbalance between the UK’s share in payments to the budget and its share in the expenditures.8 The cost of the UK rebate is divided among EU member states in proportion to the share they contribute to the EU's GNI. However, Germany, the Netherlands, Austria, and Sweden, who considered their relative contributions to the budget to be too high, pay only 25% of their normal financing share of the UK correction. The Netherlands and Sweden benefit from gross reductions in their annual GNI contribution through lump-sum payments. Finally, Germany, the Netherlands, Austria, and Sweden benefit from reduced rates of call for the VAT own resource.9 Altogether, these correction mechanisms reduce the contributions some countries pay.
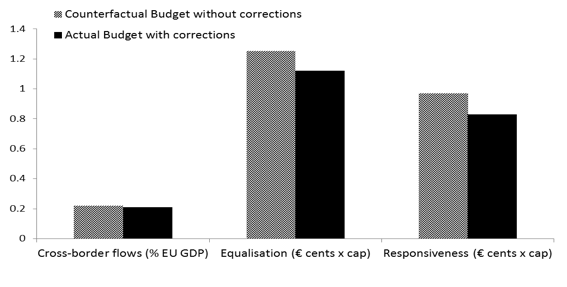
It is possible to measure their impact on the redistributive capacity of the budget by building a counterfactual budget without these corrections, and comparing its redistributive capacity to the actual one. The results show that the corrections do indeed have a significant net impact in reducing the redistributive capacity of the budget on the revenue side.
Figure 3. Redistributive capacity of the budget with and without correction mechanisms
The redistributive capacity of the budget is therefore reduced by the mechanism of corrections applied to it. Given the already limited redistributive capacity of the budget previously illustrated, these small impacts have a non-negligible effect – cross-border flows are diminished by 5%, the equalising effect is diminished by 10%, and the overall responsiveness is reduced by 14%, compared with a scenario without corrections.
Conclusion
The net redistributive impact of the EU budget is rather small and, contrary to what is commonly believed, the revenue side is more progressive than the expenditure side. The budget is not particularly responsive to changing economic conditions either, and only the revenue side is significantly correlated with changes in income per capita over time. The expenditure side is more rigid due to its structure. The various correction mechanisms applied to the budget reduce its redistributive capacity.
The extent to which these results suggest policy recommendations depends on the extent to which the redistributive function of the EU budget is considered relevant. If this is the case, then some considerations are in order.
First, on the revenue side, the reform of the own resources system should carefully assess the possible substitution of the national contribution based on GNI with another source of revenue. Since the national contribution based on GNI is the main source of redistribution (and also of stabilisation) of the budget, its reduction could reduce the already minimal capacity of the budget to perform these functions. The key parameter then would become the tax base chosen for the new source; if it was a highly cyclical base, the loss of redistributive capacity could be mitigated.
Second, on the expenditure side, the shift from pre-allocated types of expenditures towards non-pre-allocated ones brings significant redistributive effects. As the analysis shows, Heading 1b has a significant redistributive effect, which is counteracted by the negative redistributive effect of Heading 1a. So far the latter is considerably smaller than the former, but shifting the relative balance between the two would determine a reduction of the overall redistributive capacity of the budget.
Authors’ note: The opinions expressed in this column are the authors’ alone and do not reflect those of the European Commission.
References
D'Apice, P (2015), “Cross-border flows operated through the EU budget: an overview”, Directorate General Economic and Financial Affairs (DG ECFIN), European Commission. Discussion Papers 19.
Feyrer, J, and B Sacerdote (2013), “How much would us style fiscal integration buffer european unemployment and income shocks? (a comparative empirical analysis)”, The American Economic Review, 103 (3), 125-128.
Pasimeni, P and S Riso (2016), “The redistributive function of the EU budget”, IMK at the Hans Boeckler Foundation, Macroeconomic Policy Institute, No. 174-2016.
Endnotes
[1] Redistribution is considered here only as net cross-country transfers operated through the budget, and it requires looking at both sides of the budget, revenues and expenditures.
[2] It is important to remember that this concept provides only a limited indication of all the possible benefits arising from EU policies, which go beyond the simple account of payments to and from the budget. It is used as a proxy to perform a quantitative assessment of the redistributive capacity of the EU budget. For a detailed explanation of its calculation, see Annex 3 of the Financial Report 2014.
[3] Measured by the Pearson coefficient. If we use a non-parametric coefficient (Spearman coefficient), which is less sensitive about the outliers, the correlation is stronger.
[4] Heading 1a: Competitiveness for growth and employment; Heading 1b: Cohesion; Heading 2: Preservation and management of natural resources; Heading 3: Citizenship, freedom, security, and justice; Heading 4: EU as global player; Heading 5: Administration.
[5] The first category mainly consists of customs duties on imports from outside the EU and sugar levies. Member states keep 25% of the amounts as collection costs. The second category consists of resources based on the value-added tax (VAT), whereby a uniform rate of 0.3% is levied on the harmonised VAT base of each member state, and a national contribution based on their gross national income (GNI), whereby each country transfers a standard percentage of its GNI to the EU. The different types of own resources and the method for calculating them are set out in a Council Decision on own resources. It also limits the maximum annual amounts of own resources that the EU may raise during a year to 1.23% of the EU gross national income (GNI).
[6] Although designed to cover the balance of total expenditure not covered by the other own resources, the contribution Member States provide based on their GNI has become the largest source of revenue of the EU budget.
[7] Heading 4 is mainly directed to third countries, outside the EU. However, a small amount of it is also dedicated to help pre-accession countries achieve a minimum degree of convergence with EU countries. This is relevant in explaining our results because the Member States that joined the EU in 2004 (and 2007) still benefitted by some expenditures under this heading after the accession. This explains why Heading 4 has a significant, although small, redistributive impact in the period considered.
[8] This mechanism has been modified on several occasions to take account of changes made to the system of EU budget financing, but the essential principles remain the same. The UK is reimbursed by 66% of the difference between its contribution and what it receives back from the budget.
[9] Reduced VAT call rates for Austria (0.225%), Germany (0.15%), the Netherlands and Sweden (0.1%).


