The concentration of wealth far exceeds the concentration of labour income, and exhibits rapid growth in the US and around the world (Piketty 2014, Saez and Zucman 2016). Economic theory suggests that capital income should play a fundamental role in explaining these facts because returns on household savings accumulate multiplicatively over time (Benhabib Bisin and Zhu 2011, Cagetti and de Nardi 2008). Furthermore, the impact of capital income might be considerably magnified if the wealthy select portfolios with higher and riskier returns than the middle class, as Piketty (2014) and Gabaix et al (2016) suggest.
The data challenge
Empirical research on capital income has until now been hampered by the lack of accurate micro data. To analyse the investments of the wealthy, one needs to use a dataset that extensively samples households at the very top and gives them incentives to truthfully report their assets. Holdings should also be measured exhaustively, preferably at the level of each asset or security. Traditional datasets do not meet these requirements. For instance, the US Survey of Consumer Finances contains only about 700 households from the top 1% of the wealth distribution, and the response rate in the top percentile is only 12%.
In a recent paper, we overcome these limitations by considering an extensive administrative panel containing the wealth records of Swedish residents at the end of each year (Bach et al. 2017). The dataset contains 42,000 households each year from the top 1% of the wealth distribution. It contains the debt and disaggregated holdings of every household, reported at the level of each bank account, financial security, private firm, and real estate property.
Risk and return characteristics of gross wealth
We term total gross wealth a household’s portfolio of financial, real estate, and private equity assets, excluding debt from consideration. Wealthier households allocate a substantially higher fraction of total gross wealth to risky assets compared to the median household. The share of risky assets increases monotonically with net worth, reaching 21% for the median household, 62% for the top 1%-0.5%, and 95% for the top 0.01%.
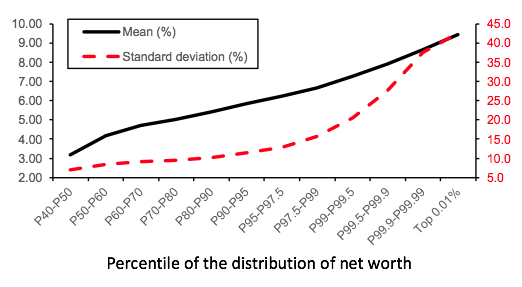
High-net-worth households correspondingly take high levels of risk, as Figure 1, Panel A, illustrates. They achieve high systematic exposure:
- by allocating a high share of gross wealth to risky assets; and
- by picking risky assets that load aggressively on systematic risk factors.
Wealthy households also bear highly idiosyncratic risk through substantial direct holdings of private and public equity.
As a result of these risk exposure patterns, the expected return on total gross wealth monotonically increases with household net worth. Compared to the median household, the expected return on total gross wealth is 2.7% per year higher for the top 10%-5% of households, 4.1% per year higher for the top 1%-0.5%, and 6.2% per year higher for the top 0.01% (see Figure 1, Panel A). These results confirm the conjecture of Benhabib et al. (2011), Piketty (2014), and others that wealthier households earn higher average returns.
The importance of leverage
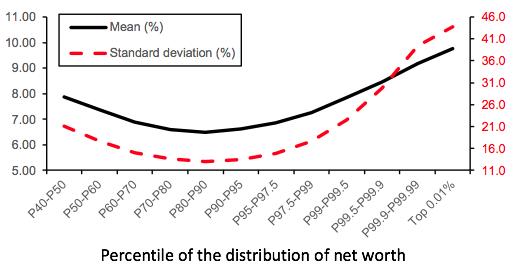
We next consider household net wealth, defined as total gross wealth minus debt. In contrast to gross wealth, net wealth earns an expected return that is U-shaped across brackets of net worth (see Figure 1, Panel B). Middle-class households have highly leveraged positions in real estate that generate high mean returns on net wealth. Upper-middle-class households have lower leverage and lower average returns. At the very top, households have very little personal debt but achieve high expected returns by bearing high systematic risk.
Figure 1 Risk and return characteristics of household wealth
A. Gross wealth
B. Net wealth
A level playing field?
We show that the high returns earned by the wealthy are unlikely to be generated by informational advantages or exceptional investment skills. We find no empirical evidence that the rich can better pick stocks and generate higher risk-adjusted returns than other households. Similarly, we do not measure abnormal risk-adjusted returns on real estate and private equity holdings.
We verify the robustness of our results on a dataset containing the yearly returns of US foundations over a 28-year period. Consistent with Saez and Zucman (2016), we show that wealthier foundations earn higher average returns, which mirrors the patterns in Swedish household wealth data. We establish that the realised returns of US foundations are fully explained by their exposures to the equity market, while exceptional investment skill cannot be detected.
Implications for the dynamic of wealth inequality
Our findings have several implications for the dynamics of household wealth inequality. Our results suggest that the allocation of risk across households is a key component of the current debate on inequality. We also show that capital income is a key driver of the wealth inequality dynamics. We develop a simple model of wealth accumulation in which returns are fully capitalised while other factors, such as savings and demographics, are not considered. The model explains with good accuracy the level and volatility of the growth rate of top wealth shares.
In an out-of-sample exercise, we use an asset-pricing model to simulate returns and we establish that observed portfolios imply that the share of total wealth held by the top 0.01% should grow on average by 4.5% per year on average if households simply capitalise their returns, a pace of increase that is comparable to recent US estimates. The projected increase in wealth inequality is almost entirely driven by the fact that the rich hold both more systematic risk (generating high returns) and more idiosyncratic risk (generating exploding fortunes at the top), and invest in highly levered private firms (generating returns with a fat right tail).
References
Bach, L, L E Calvet and P Sodini (2017), “Rich pickings? Risk, return, and skill in the portfolios of the wealthy” CEPR Discussion Paper No. 11734.
Benhabib, J, A Bisin, and S Zhu (2011), “The distribution of wealth and fiscal policy in economies with finitely lived agents”, Econometrica 79: 122-157.
Cagetti, M and M De Nardi (2008), “Wealth inequality: Data and models”, Macroeconomic Dynamics 12: 285-313.
Gabaix, X, J-M Lasry, P-L Lions, and B Moll (2016), “The dynamics of inequality”, forthcoming Econometrica.
Piketty, T (2014), Capital in the twenty-first century, Harvard University Press.
Saez, E and G Zucman (2016), “Wealth inequality in the United States since 1913: Evidence from capitalized income tax data”, Quarterly Journal of Economics 131: 519-578.


