One of the most fundamental and controversial issues in economics is the relationship between economic performance (per capita output and growth rates) and equality (income distribution). Does more equality spur or hinder economic performance? In what direction is the causality running? Such questions are of paramount political importance and have been continuously analysed and debated.
It is an interesting development in this discussion that major international institutions like the OECD, the IMF, and the World Bank have recently published studies suggesting that economic performance is positively related to income equality (e.g. Cingano 2014, Ostroy et al. 2014, and Brueckner and Lederman 2015). Based on cross-country evidence, these studies find that countries with less income inequality tend to have a better economic performance than countries with more income inequality. Although the exact empirical findings vary across these studies and depend on the included set of countries, these are interesting findings. A more popular version of the same story appeared in the widely read book The Spirit Level by Wilkinson and Pickett (2009).
Such findings seem to run counter to standard reasoning in economic textbooks pointing to a trade-off between economic performance and income equality (or efficiency and equity in the economics jargon). Okun (1975) dubbed this the “big trade-off” and explained it by the metaphor of the leaky bucket: "The money must be carried from the rich to the poor in a leaky bucket. Some of it will simply disappear in transit, so the poor will not receive all the money that is taken from the rich” (p. 91).
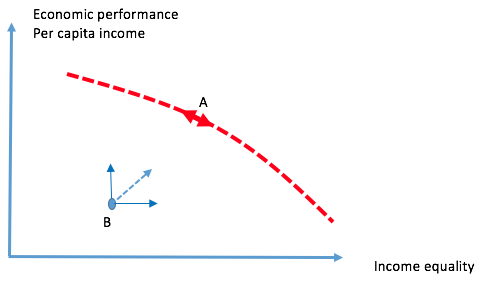
The point is that if the distribution of market income is considered politically unacceptable, policies like taxes and transfers can contribute to ensure a more equal distribution of income. However, this comes at the costs of distorting incentives for work, education, investment and so on, which in turn leads to a worse economic performance. This viewpoint is illustrated in Figure 1. The dotted line gives the trade-off, and a country positioned at A faces a trade-off. If it wants more equality, this can be attained by redistributive policies, but at the cost of lower economic performance or vice versa. The trade-off between economic performance and equality gives ‘the price’ of attaining more equality, and the willingness to pay determines the extent of redistribution policies. Basic economic reasoning ultimately revolves around this trade-off. Is this reasoning falsified and made redundant by the empirical findings that economic performance and income equality tend to be positively correlated?
Figure 1 The trade-off between economic performance and equality
To address these questions, one has first to note a subtle but important point in the interpretation of economic theory. The trade-off applies at the frontier of the possibility set of combinations of economic performance and income equality available to policy makers. If policies and institutions are ‘well-designed’, the country is at the frontier. There is no free lunch and a trade-off inevitably arises.
However, there may be many historical, institutional and political reasons why countries are not at the frontier. In short, for various reasons countries may be inside the opportunity set at a position like B in Figure 1, in which case there is scope for improvements in both economic performance and income equality. The theoretical literature includes numerous cases showing how either specific policy choices or institutional changes can lead to improvements in both dimensions. Of course, the split of the potential gains from such reforms depends on political preferences.
This insight leaves one important message. In cross-country comparisons it is important to make a distinction between countries at (or close to) the frontier and countries well inside the frontier before drawing any conclusions on the relationship between economic performance and income equality available for policymakers. Essentially, differences in the distance to the frontier should be accounted for in the comparison.
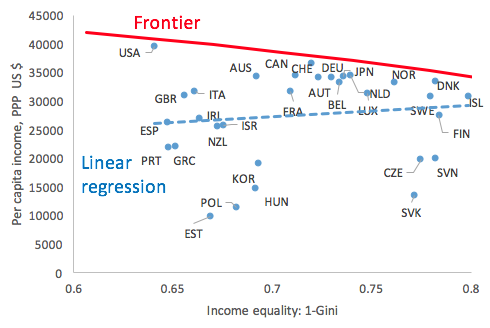
In Figure 2 we take a bold approach in assessing economic performance and income equality in a cross-country perspective. Economic performance is measured by per capita income, and income equality as 1 minus the Gini coefficient. The Gini coefficient is the most widely used measure of inequality in the income distribution, and it is defined to be between 0 and 1. The higher the value, the more unequal the distribution of income. The metric 1-Gini thus measures the equality of the income distribution. The precise measurement of economic performance (efficiency) and income equality (equity) can be discussed at length – our point here is to employ the most widely used metrics used in cross-country comparisons. The countries included in the Figure are the high-income OECD countries and the data is from 2010 (in Andersen and Maibom 2016, we show similar charts for 1980-2010, and they all look similar).
Figure 2 Cross-country data on per capita income and income equality
Note: Data applies to 2010; for details on data and estimation methods and results, see Andersen and Maibom (2016).
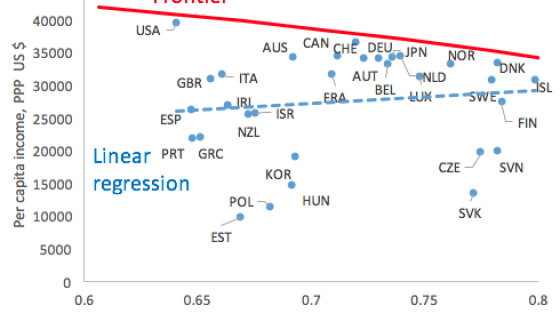
The first point to note is that the simple correlation between per capita income and income equality is positive, as indicated by the dotted line (linear regression). This is essentially the positive relationship found in the more elaborate and sophisticated studies referred to above. However, the insights from economic theory suggest that this approach is problematic, as it does not take the frontier of the opportunity set into account (it implicitly assumes that countries do not differ in their distance to the frontier). It is thus very unclear what to conclude from the finding of a positive correlation between per capita income and income equality for the trade-off and thus the policy scope. Essentially, the resulting correlation mixes up movements towards the frontier and movements at the frontier.
There exists a statistical method (‘stochastic frontier analysis’) which can be used to establish both the best-practice frontier as well as its properties. The basic idea in this approach is that, for various reasons, countries can be inside the opportunity set or at the frontier, but never above the frontier. This truncated nature of the problem needs to be taken explicitly into account when approaching the data, and it is clearly neglected by a simple correlation or linear regression. We do this in Andersen and Maibom (2016) for a sample of OECD countries over the period 1980-2010 and estimate a best practice frontier, which is displayed in Figure 2. The best practice frontier has a negative slope in accordance with economic theory. This finding is robust to various changes in the number of countries included, different sample periods, etc. We also show – in accordance with standard economic theory - that an increase in the tax burden is associated with a deterioration in economic performance but more income equality for countries at or close to the frontier.
There has been a vivid debate over whether the trade-off between economic performance and income equality has been more steep due to, among other things, technological changes, globalisation, etc. We are not able to find statistical support that the trade-off along the best practice frontier has changed over the period 1980-2010. However, some countries have shifted position. As an example, both the US and Sweden have consistently been at or close to the frontier over the sample period. Both counties have experienced declining income equality over the sample period, corresponding to a movement towards north-west along the frontier. This suggests that the main driver underlying the observed increase in income inequality is political changes.
It is interesting that countries that are often highlighted in policy discussions as ‘model examples’ like the US, Switzerland and the Nordic countries have consistently been at or close to the frontier. For countries well inside the opportunity set, it is an implication of this study that they have scope for improvements in both economic performance and income equality by moving closer to the frontier.
References
Andersen, T M, and J Maibom (2016), “The big trade-off between efficiency and equity - is it there?”, CEPR Discussion Paper 11189
Brueckner, M, and D Lederman (2015), “Effects of income inequality on aggregate output”, World Bank Policy Research Working Paper 7317
Cingano, F (2014), “Trends in income inequality and its impact on economic growth”, OECD Social, Employment and Migration Working Papers, No, 163, OECD Publishing
Okun, A M (1975), Equality and efficiency, the big tradeoff, Washington, DC: Brookings Institution.
Ostroy, J D, A Berg, and C G Tsangaridaes (2014), “Redistribution, inequality and growth”, IMF Staff Discussion Paper SDN/14/02
Wilkinson, R, and K Pickett (2009), The spirit level: Why equality is better for everyone.


