The EU is determined to achieve climate neutrality by 2050. The environmental benefits of this resolution will be global, but will the burden be equally shared worldwide? What is the risk for the EU to incentivise relocation or imports of high carbon footprint production from emissions havens?
Carbon leakage
is a risk of environmental policies adopted without international coordination (Ishikawa and Cheng 2021). While scholars tend to agree that leakage has remained limited after the introduction of the EU Emissions Trading System (ETS) (Dechezleprétre et al. 2022, aus dem Moore et al. 2019), they tend to argue in favour of exempting exports from carbon pricing (Weder di Mauro et al. 2021). However, their conclusions assume market conditions that the ‘Fit for 55’ package, with the aim of reducing net greenhouse gas (GHG) emissions in the EU by at least 55% by 2030, could rapidly change. In line with the reduction in emission allowances in recent years, the price of emissions, which represents the cost companies must pay for polluting in the EU and thus determines the incentive to relocate to unregulated regions, has increased considerably.
Against this backdrop, to preserve competitiveness of firms in the region and prevent carbon leakages, a carbon border adjustment mechanism (CBAM) on imports will charge foreign companies the same price paid by local businesses for their emissions when supplying the EU. By charging the same price irrespective of the geographical location of emissions and producers, the CBAM aims at placing companies on an equal footing in the EU market, offsetting eventual competitiveness losses.
In this column, we contribute to the debate about the efficacy of EU green policies and their fallout on EU firms’ competitiveness in three distinct ways. First, we provide new evidence on the ETS efficacy in curbing EU carbon emissions; at the same time, we highlight that the success came with costs. Carbon leakage occurred in regulated industries, and they appear less negligible than previously identified. Second, we present the result of a novel study about the anti-competitive effects on EU industries associated to the ETS implementation. We shed light on the fact that uniformly applied policies can still produce differential effects on firms’ output depending on their company’s ownership structure. Finally, because the choice to introduce a CBAM is connected to incentives for companies to dodge costly regulation, our analysis sheds light on the conditions under which it could deliver the EU’s climate neutrality goal (Böning et al. 2023).
The ETS has delivered on its mandate, but prompted carbon leakage in regulated industries
A provisional deal on a revised ETS has already been reached and the discussion about introducing a CBAM on imports are at an advanced stage.
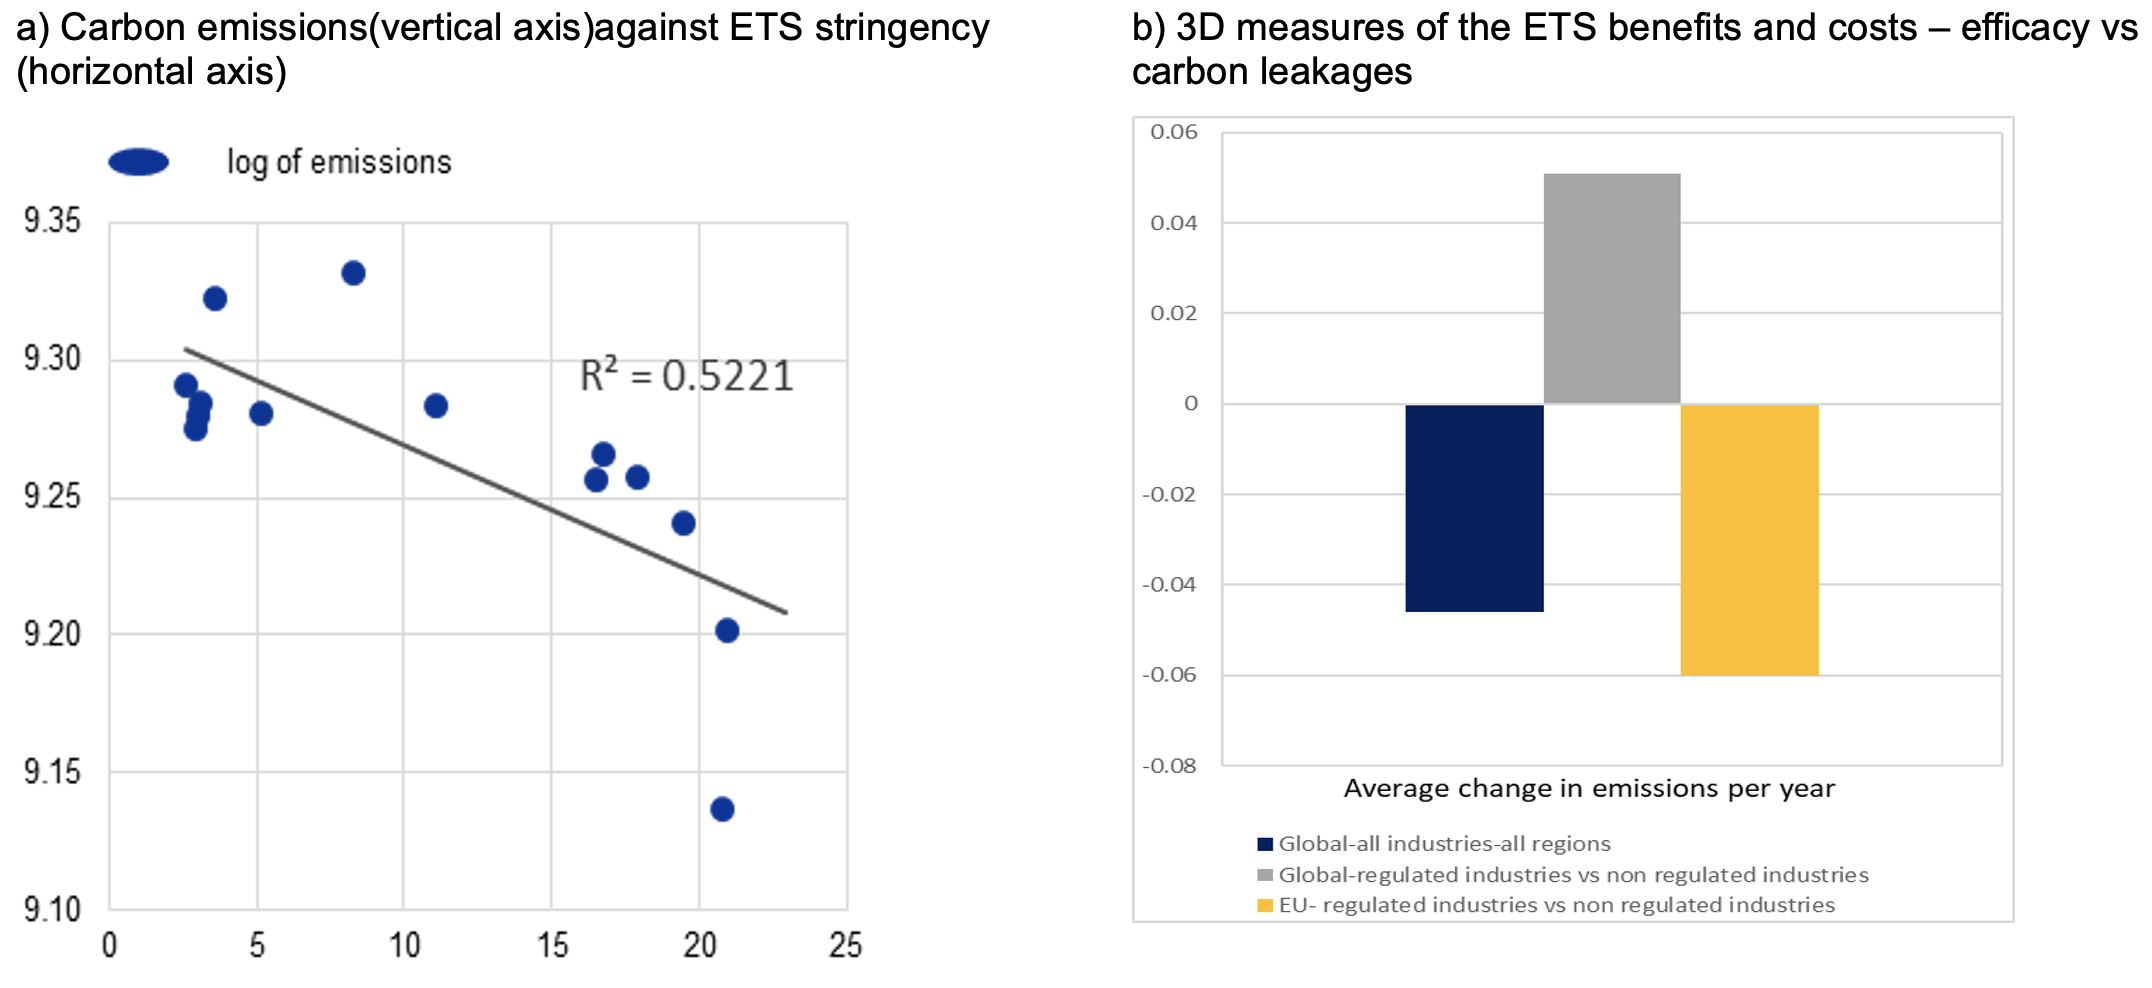
A prerequisite for the new deal to work is proving that the existing ETS scheme has indeed reduced regional and global emissions. We determine the effectiveness of the ETS in two ways. Firstly, by looking at yearly emissions we can see that these are negatively correlated with ETS stringency, which is proxied by the share of traded in total allowances in the previous year.
The linear negative association explains more than half of the variance in the average log of yearly emissions (see Chart 1). These are estimated to have declined by about 2 percentage points more for each unitary increase in the ETS stringency.
The economic mechanism can be summarised by some firms investing in cleaner technology and selling unneeded emissions allowances. Meanwhile, other firms may cut back on production, thereby reducing emissions and allowing them to sell the saved emissions permits. To corroborate this hypothesis, we also find that pricier emissions and more stringent caps accelerated the EU greening process after 2013. Thereby, we conclude that the pricing mechanism was effective as emissions declined faster the higher the stringency and the higher the price of each emission permit, in line with other analyses in the literature (Känzig 2023).
Figure 1 ETS efficacy and associated carbon leakages
Sources: Tonnes of CO2 equivalent greenhouse gas emissions are from the European Environment Agency (EEA), which also provides the number of allowances and the amount of surrendered emissions by sector and country since 2005.
Notes: The sectoral emissions plotted in the left hand side chart were regressed against sectoral trends, country, time and sector characteristics then averaged across sectors. The scatter bin-plot show that the emissions, unexplained by these determinants, correlate negatively with the ETS stringency. ETS stringency is proxied with the lagged value for the shares of traded allowances over total allowances. The 3D measure of ETS benefits and costs are derived from a diff-in-diff-in-diff estimate of yearly log emissions between 2005 and 2018, on its lagged value, country, sector, time fixed effects price of emissions, sectoral trend and country deterministic trends. The blue bars is the reduction in global emissions after the ETS came into force in 2005. The grey bar shows the change in emissions in ETS industries but global level. They are offsetting the global reduction. Last, the yellow bar depicts the average change in emissions of ETS industries in the EU relative to the average change in emissions of the same industries but global level (grey bar). Overall, EU efforts to reduce emissions were countered by the increase in global emissions of ETS industries.
However, these achievements came with costs that are uncovered when the study is extended to unregulated industries and regions. A distinct analysis estimates the ETS’s efficacy through a ‘3D’ (difference-in-difference-in-difference) approach which leverages on the triple dimensional (time-sector-region heterogeneity) to identify the scheme’s effects, while controlling for emissions autoregressive processes, sectoral trend and time, industry and country fixed effects. This second analysis confirms that the ETS resulted in cuts in the EU’s GHG emissions of approximately 2–2.5 percentage points per year. Nevertheless, unlike earlier studies which found limited empirical evidence of carbon leakages, our analysis finds that heavy emissions activities increased outside the EU, as emissions in regulated industries within the EU declined. Against a backdrop of declining emissions since 2005 (Figure 1b, blue bar), the global yearly emissions by regulated industries rose over the same period (grey bar). Thus, the additional reduction in regulated industries within the EU (yellow bar) were offset by a simultaneous rise in emissions of those same industries elsewhere. This runs counter to the EU’s efforts to also help reduce emissions globally.
The ETS’s anti-competitive effects: A guide for the equal footing of the CBAM
In order to see whether the ETS equally incentivised all companies to relocate or import emission intensive inputs, we utilised information on sectoral output values and input-output linkages. We also distinguished companies by location (within and outside the EU) and ownership structure (domestic and foreign affiliates of multinational enterprises) which we match with industry’s emissions and ETS prices.
We then regress the value of production by sector-country and ownership type on (1) emissions intensity by sector-country-ownership type, (2) exposure to emission intensive inputs distinguishing them by sourcing region (EU and outside the EU), and (3) the cost of the exposure to EU ETS regulation.
The aim is to verify whether a uniform regulation can trigger differentiated effects depending on the companies’ ownership and the exposure of production to high-carbon footprint inputs, which are either sourced from within the EU and, hence, covered by the ETS or from outside the EU.
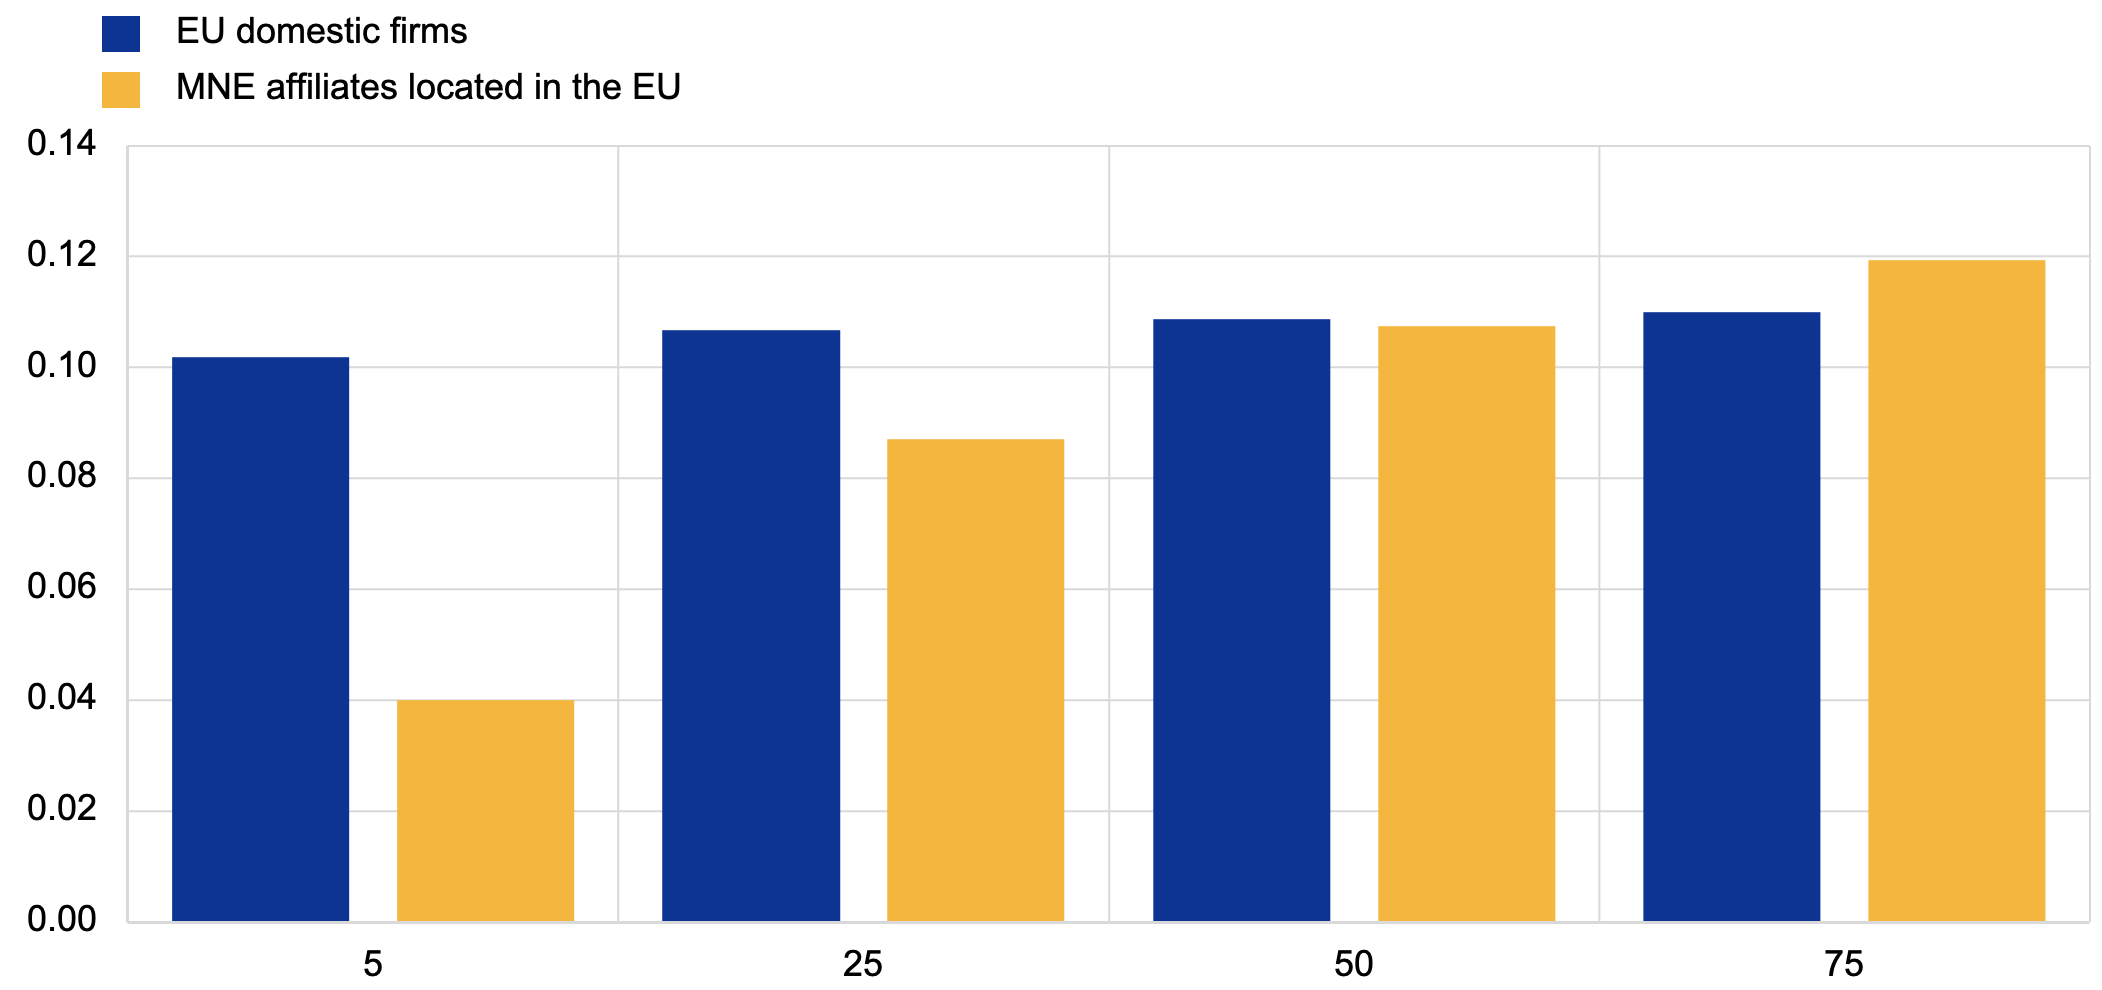
We find the EU production in regulated sectors to generally be more sensitive to emissions intensity than non-EU production, irrespective of the company ownership structure. We also find that purchasing high-emission inputs from within the EU translates into a competitive disadvantage for companies located within the EU. For these companies, shifting the sourcing of inputs from within to outside the EU raises total production but to a different extent for domestic and foreign owned companies. Specifically, the production of domestically owned companies in regulated industries from within the EU correlates negatively with the share of high-carbon footprint inputs sourced from within the EU and correlates positively with the share of the same inputs when they are sourced from outside the EU. Production of foreign-owned companies behaves similarly in terms of correlations across sourcing regions. However, the impact of a reshuffling across sources of emission intensive inputs from within to outside the EU grows larger as the price for allowances rises (Figure 2). Because ETS prices have risen in recent years and are anticipated to continue growing as the FIT-for-55 package comes into force, the incentive to change sources for foreign owned companies is ever growing. Against this background, foreign-owned companies seem better placed to dodge the regulation and reshuffle their inputs sources in favour of those located outside the EU unless these are also held accountable for their emissions when supplying the EU customers. The analysis does not reach the same conclusions when investigating production of companies located in the EU but operating in unregulated sectors; reshuffling across input sources in this case did not lead to any sizeable increase in total production, at least not for the time under consideration.
Figure 2 Sourcing high-carbon footprint inputs: The effect on production of a 1 percentage point shift from the regulated EU to unregulated regions (in percentage points)
Sources: OECD-AMNE, authors estimations
Notes: The chart depicts the effect of a hypothetical shift by one percentage point across sourcing regions of high carbon footprint inputs from within to outside the EU based on estimates from regression analysis. The log value of sectoral production is regressed on country-sector-ownership fixed effects, emission intensity (emissions per euro worth of production), log value of inputs and the four shares of high carbon footprint inputs sourced from Domestic and MNE companies. The coefficient on these four regressors return the sensitivity of sectoral production to emission intensive inputs depending on regions they are originated, e.g. from within and outside the EU. The specification also includes the interaction of these shares with the price paid on allowances in t-1, to capture the non-linearity of exposure to ETS regulation depending on the cost/price for allowances. The equation specification encompasses also deterministic country and industry trend and time unobserved heterogeneity, besides proper country-sector-ownership type fixed effects. Matching the AMNE and WIOD databases eventually yields 34 sectors and 44 countries (including RoW) spanning 2000-2016. Regulated (ETS) industries are Coke and refined petroleum products (C19), Basic metals (C24), Other non-metallic mineral products (C23), Electricity, gas, water, waste and remediation (DTE), and Transport and storage (H).
Conclusion
Overall, our study confirms that the ETS is effective in curbing EU emissions, but at the cost of burdening companies in the EU, especially domestic ones, and triggering carbon leakages. Different sensitivity of EU production to sourcing of emissions-intensive inputs depending on the company’s ownership, suggests that some business models may have more leeway in reorganising production processes and sourcing high-carbon footprint inputs from outside the EU. Because the new EU environmental legislation aims at preventing similar behaviour through the CBAM, there is a need for a careful design of this mechanism, in terms of equivalent tariff charged on emissions embedded in imports and of CBAM industry’s coverage. Our analysis advises in favour of extending the application of a CBAM on all regulated productions.
References
Böning J, V Di Nino, T Folger T (2023), “Benefits and costs of the ETS in the EU, a lesson learned for the CBAM design,” ECB Working Paper No 2764.
Chan, H S R, S Li and F Zhang (2013), “Firm competitiveness and the European Union emissions trading scheme”, Energy Policy 63:1056-1064.
Dechezleprétre, A,C Gennaioli, R Martin, M Muûls and T Stoerk (2022), “Searching for Carbon Leaks in Multinational Companies," Journal of Environmental Economics and Management 112: 102601.
Dechezleprétre, A and M Sato (2017), “The Impacts of Environmental Regulations on Competitiveness," Review of Environmental Economics and Policy 11:183.
Dechezleprétre, A, D Nachtigall and F Venmans (2023), “The joint impact of the European Union emissions trading system on carbon emissions and economic performance," Journal of Environmental Economics and Management 118.
aus dem Moore, N, P Grosskurth and M Themann (2019), “Multinational corporations and the EU Emissions Trading System: The specter of asset erosion and creeping deindustrialization", Journal of Environmental Economics and Management, 94: 1-26.
Ishikawa, J, H Cheng (2021) “Carbon tax, cross-border carbon leakage, and border tax adjustments”, VoxEU.org.
Jaraite, J and C Di Maria (2016), “Did the EU ETS Make a Difference? An Empirical Assessment Using Lithuanian Firm-Level Data", The Energy Journal 37: 1-23.
Känzig, D (2023), “Climate policy and economic inequality”, VoxEU.org.
Koch, N and H Basse Mama (2016), “European climate policy and industrial relocation: Evidence from German multinational firms”, in European Climate Policy and Industrial Relocation: Evidence from German Multinational Firms.
Weder di Mauro, B, C Schmidt, K Schubert, I Mejean, X Ragot, P Martin, C Gollier, C Fuest, N Fuchs-Schündeln, M Fratzscher (2021), “Pricing of carbon within and at the border of Europe” VoxEU.org.
