In 2022, anti-poverty campaigner Jack Monroe tweeted that the UK’s national inflation index “grossly underestimates the real cost of inflation” for low-income households, listing a dozen low-price grocery products with inflation rates well above the national figure. Her post was re-tweeted over 44,000 times, leading to coverage in several national newspapers and ultimately spurring the Office for National Statistics (ONS) to launch a study of inflation rates for low-price grocery items (ONS 2022).
Despite this interest, evidence that low-income households experienced disproportionate inflation over the past few years remains scant. The ONS study found dramatic variation in inflation rates for 30 low-priced food items but, due to the small number of products it tracked, was unable to conclude that these products had higher than average inflation rates. Meanwhile, other studies using aggregate price indices concluded that inflation in 2021 and 2022 was highest for middle-income households, who spend the greatest share of their expenditures on gasoline and vehicles (Jaravel 2022).
In a recent working paper (Sangani 2023), I revisit inflation rates experienced by different income groups using micro-data on food products. I find evidence of a systematic link between upstream costs and inflation inequality, leading to excessive food inflation rates for low-income households from 2020–2023. This excessive inflation is not due to higher expenditures on aggregate categories like food and utilities (e.g. Jaravel 2022, Hormuth et al. 2023, Cavallo 2023, Soldani et al. 2023), but to differences in inflation rates across products in narrowly defined categories. These results suggest that prices of low-end products grew at double the rate of prices of high-end products from 2020–2023.
How prices react to rising costs
The source of this inflation inequality is how rising costs affect prices of low- and high-end products. To explore this, I begin by determining how the prices of products in a few narrow categories such as rice and coffee react to changes in upstream costs.
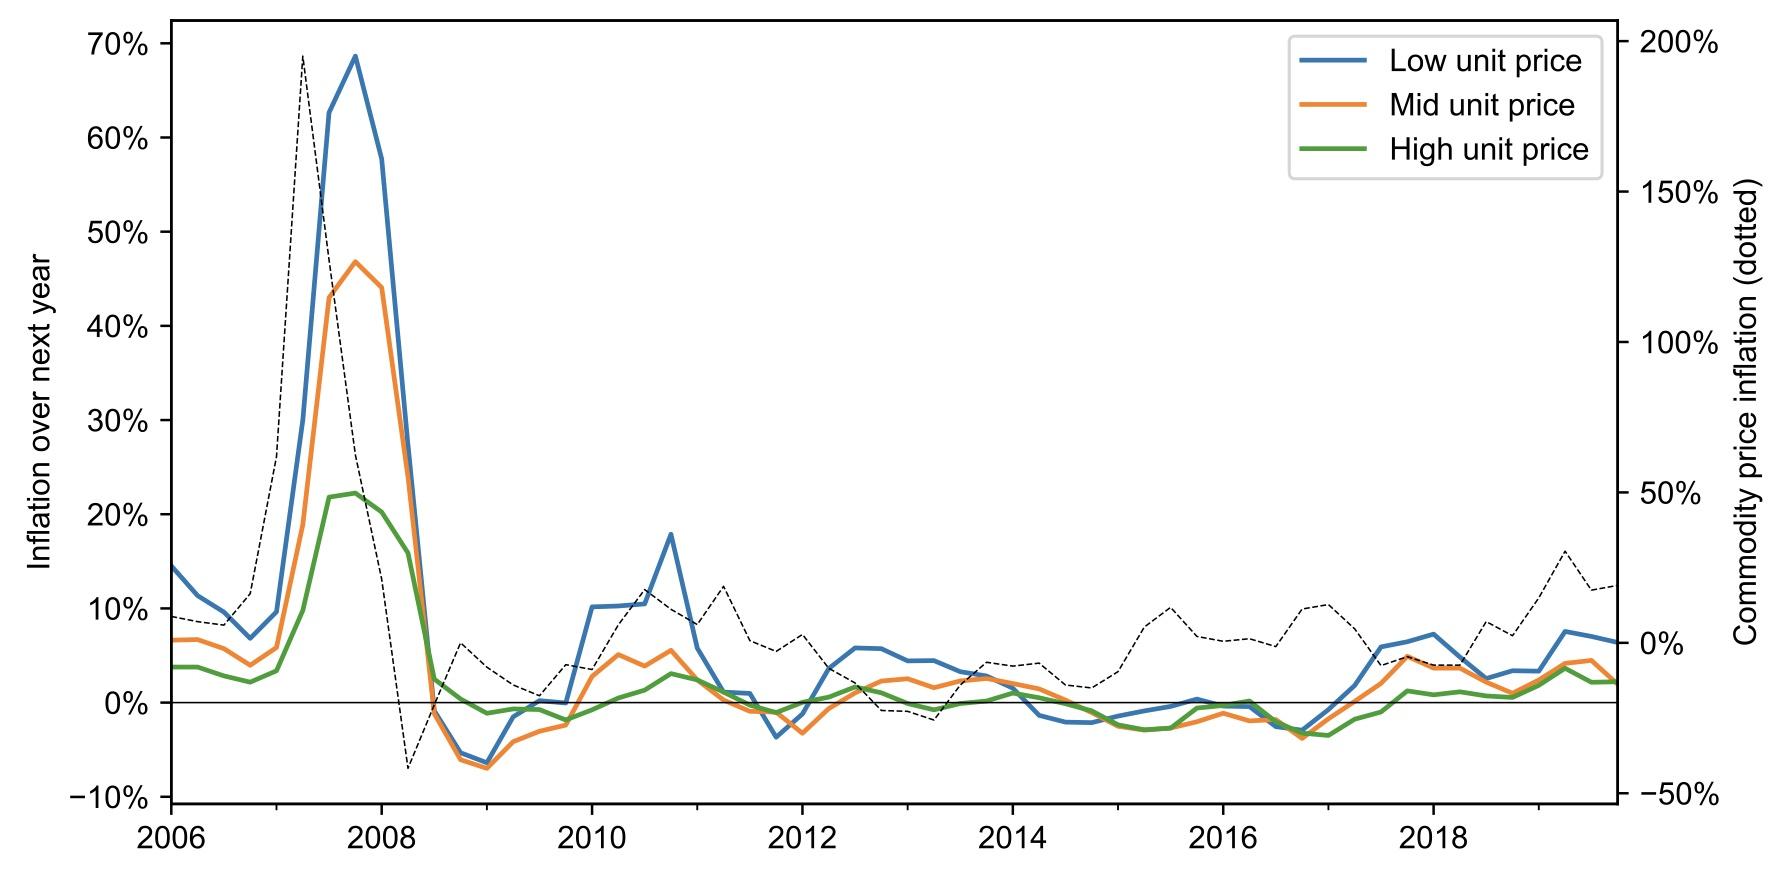
Figure 1 shows how retail prices for rice products varied with changes in rice commodity prices, which exhibited considerable volatility from 2006 to 2020. Rice commodity prices skyrocketed from $350 per tonne to more than $1000 per tonne over the spring of 2008 due to export restrictions by major exporters like India and Vietnam, before falling to under $600 per tonne by the end of 2008. Retail prices of rice products exhibit a corresponding rise and fall over 2008–2009, lagging about one quarter behind the rise and fall in commodity prices.
When changes in retail prices are measured in percentages (top panel), these commodity price movements appear to disproportionately affect the prices of low-end products. For example, inflation for rice products with low unit prices peaked at nearly 70% in 2008, compared to 20% for rice products with high unit prices. When rice commodity prices rebounded in 2011, low-price rice products saw excessive inflation rates of around 20%, compared to under 5% for high-price rice products.
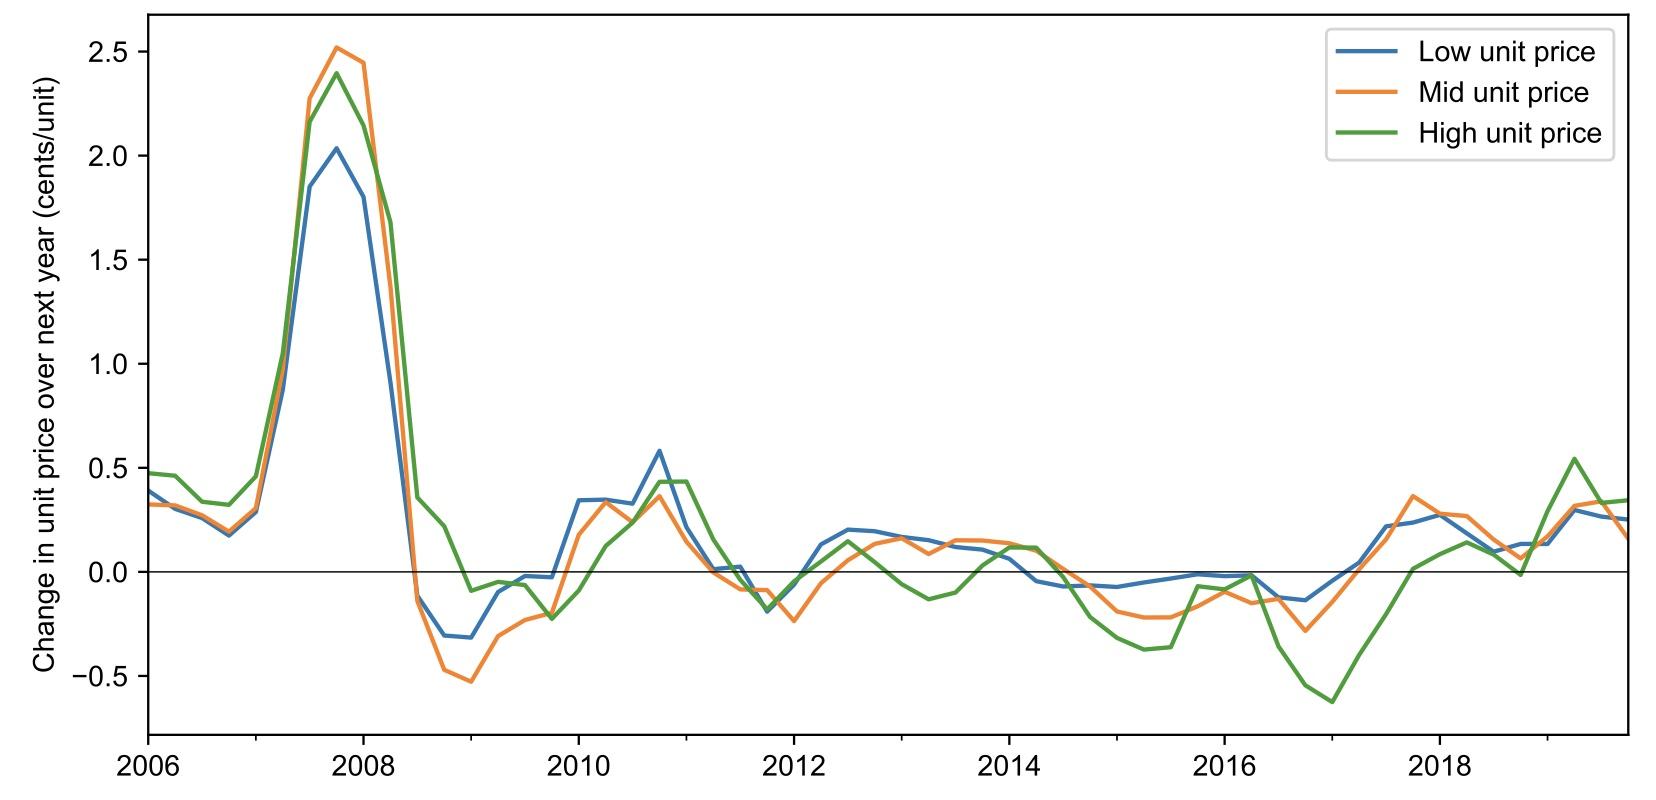
These differences in price growth across low- and high-price products largely vanish when looking at absolute price changes. For example, during the surge in rice prices in 2008, prices of low- and high-end rice products alike increased by about 2 cents per ounce (i.e. 32 cents for a one-pound bag of rice). If anything, low-price rice products saw slightly smaller absolute price increases than high-price rice products. In other words, commodity price increases result in roughly equal price changes for low- and high-end rice products. However, these price changes show up as larger inflation rates on cheaper rice products since the same price increase is compared to a smaller base price.
Figure 1 When commodity prices rise, low unit price products have higher inflation rates, though absolute price changes are similar across products
(a) Inflation (in percentages)
(b) Price change (in levels)
Note: Figure 1 shows average price growth in percentages (top panel) and levels (bottom panel) for rice products. Products are grouped by terciles of unit price (price per ounce of rice) using average unit prices over the prior year.
In my paper, I show that this pattern emerges across several product categories and markets: when input costs rise, low-end products within the category have disproportionately high levels of inflation, even though absolute price changes are similar for all products.
Within-category inflation inequality
Since low- and high-end products have different sensitivity to upstream costs, households can face different inflation rates depending on which products they purchase. Previous studies show that even within narrow product categories, low-income households tend to purchase products with lower prices and margins (Handbury 2021, Sangani 2023b). In other words, low-income households buy precisely those products whose inflation rates are most sensitive to underlying costs.
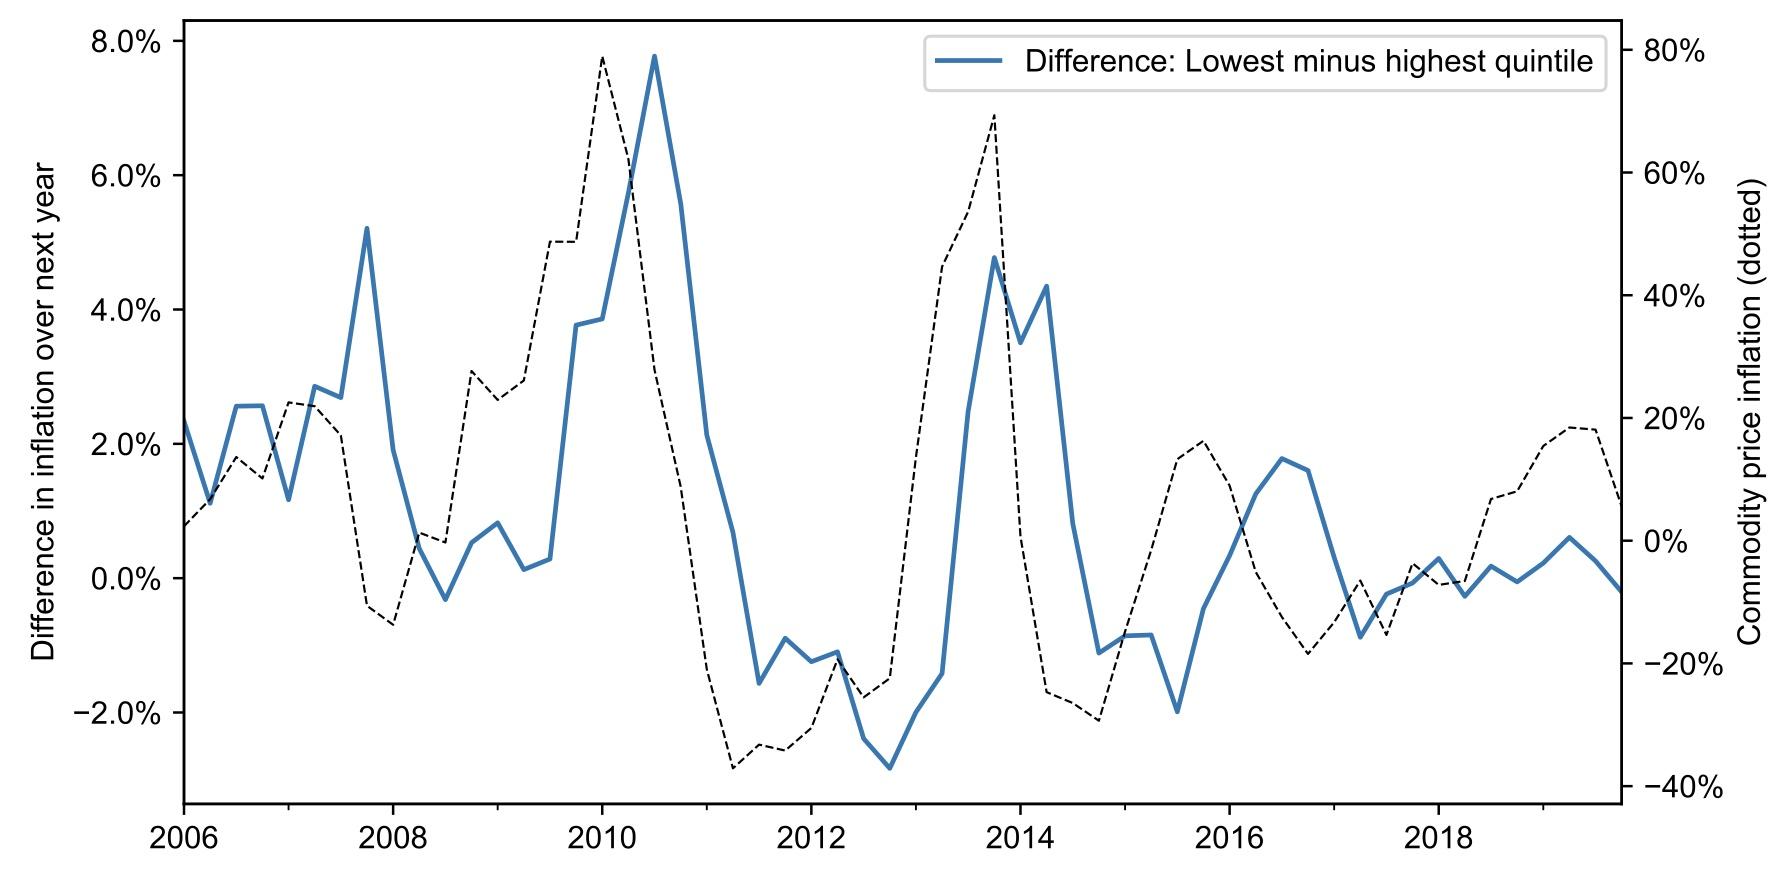
As a result, the gap in inflation for low- and high-income households fluctuates with underlying costs. The top panel of Figure 2 shows the gap between coffee inflation rates for households in the bottom 20% of the income distribution and coffee inflation rates for households in the top 20% of the income distribution.
The inflation gap widens when commodity costs are rising, reaching a peak of nearly 8% in 2010 after a surge in coffee bean prices. Meanwhile, falling coffee bean prices in 2012 resulted in inflation being 2% lower for low-income households than for high-income households.
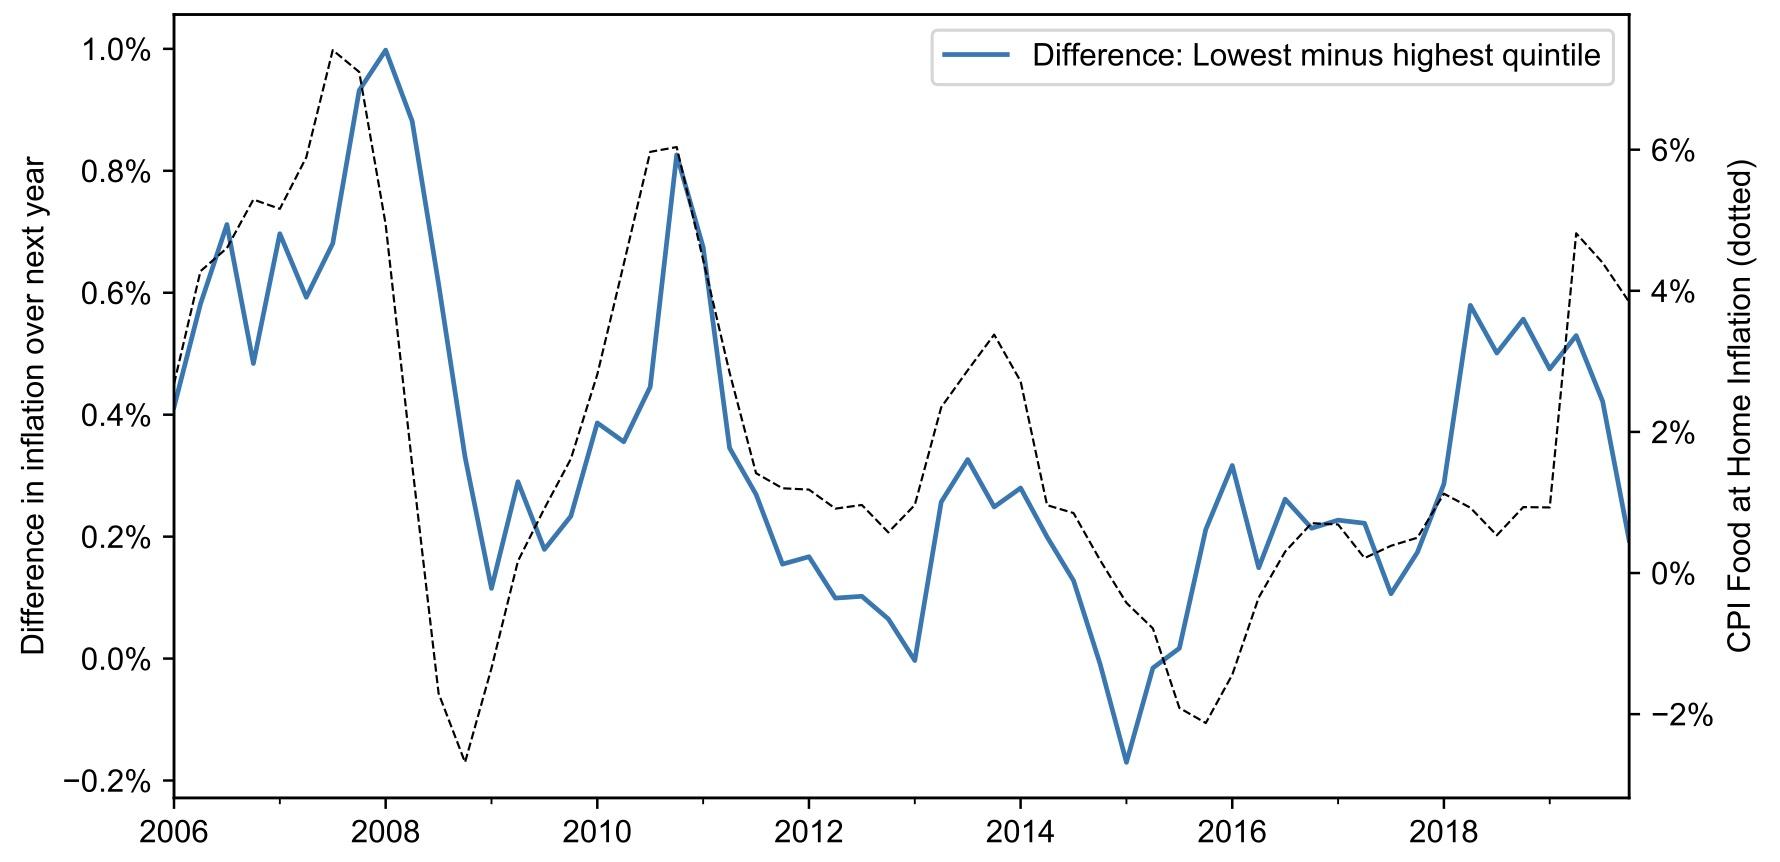
These patterns extend to the entire food-at-home basket. The lower panel of Figure 2 shows that the food-at-home inflation gap between high- and low-income households from 2006–2020 fluctuates between 1% and -0.2%. Inflation inequality is especially severe when food costs overall are rising, such as in 2007, 2011, and 2014. These cyclical patterns in inflation inequality are distinct from the secular patterns of inflation inequality documented by Kaplan and Schulhofer-Wohl (2017) and Jaravel (2019, 2021), which Jaravel (2019) attributes to innovation and entry at the high end. Instead, these cyclical patterns in inflation inequality occur because of fluctuations in upstream costs, combined with the fact that low- and high-income households consume differently priced products within narrow product categories.
Figure 2 Inflation inequality increases with commodity prices
(a) Within-category inflation inequality: Coffee (with coffee commodity inflation)
(b) Overall food-at-home inflation inequality (with CPI food-at-home inflation)
Note: Figure 2 shows the difference between inflation rates of households in the lowest 20% and highest 20% of the income distribution. Inflation rates are measured using Laspeyres price indices. Panel (a) shows the inflation gap for coffee products (blue) alongside the commodity inflation rate for coffee beans (dotted). Panel (b) shows the inflation gap for all food-at-home products (blue) alongside the CPI food-at-home inflation rate (dotted).
The food-at-home inflation gap, 2020–2023
What do these patterns mean for inflation inequality over the past few years? A combination of supply and demand shocks precipitated by the Covid-19 pandemic generated large increases in input prices for food products: from January 2020 to January 2023, producer price indices for farm products and food manufacturing rose by 50% and 30%, respectively (e.g. Rijkers et al. 2022). This increase in upstream costs exacerbates the gap in food-at-home inflation across low- and high-income households.
I estimate how food-at-home inflation rates evolved for low- and high-end products, and thus for low- and high-income households, from 2020 to 2023. To do so, I estimate how both the average level of inflation and the cyclicality of inflation with respect to upstream costs vary across products with low and high unit prices. I then combine these estimates with growth in producer price indices from 2020–2023 to estimate differences in price growth across low- and high-priced products.
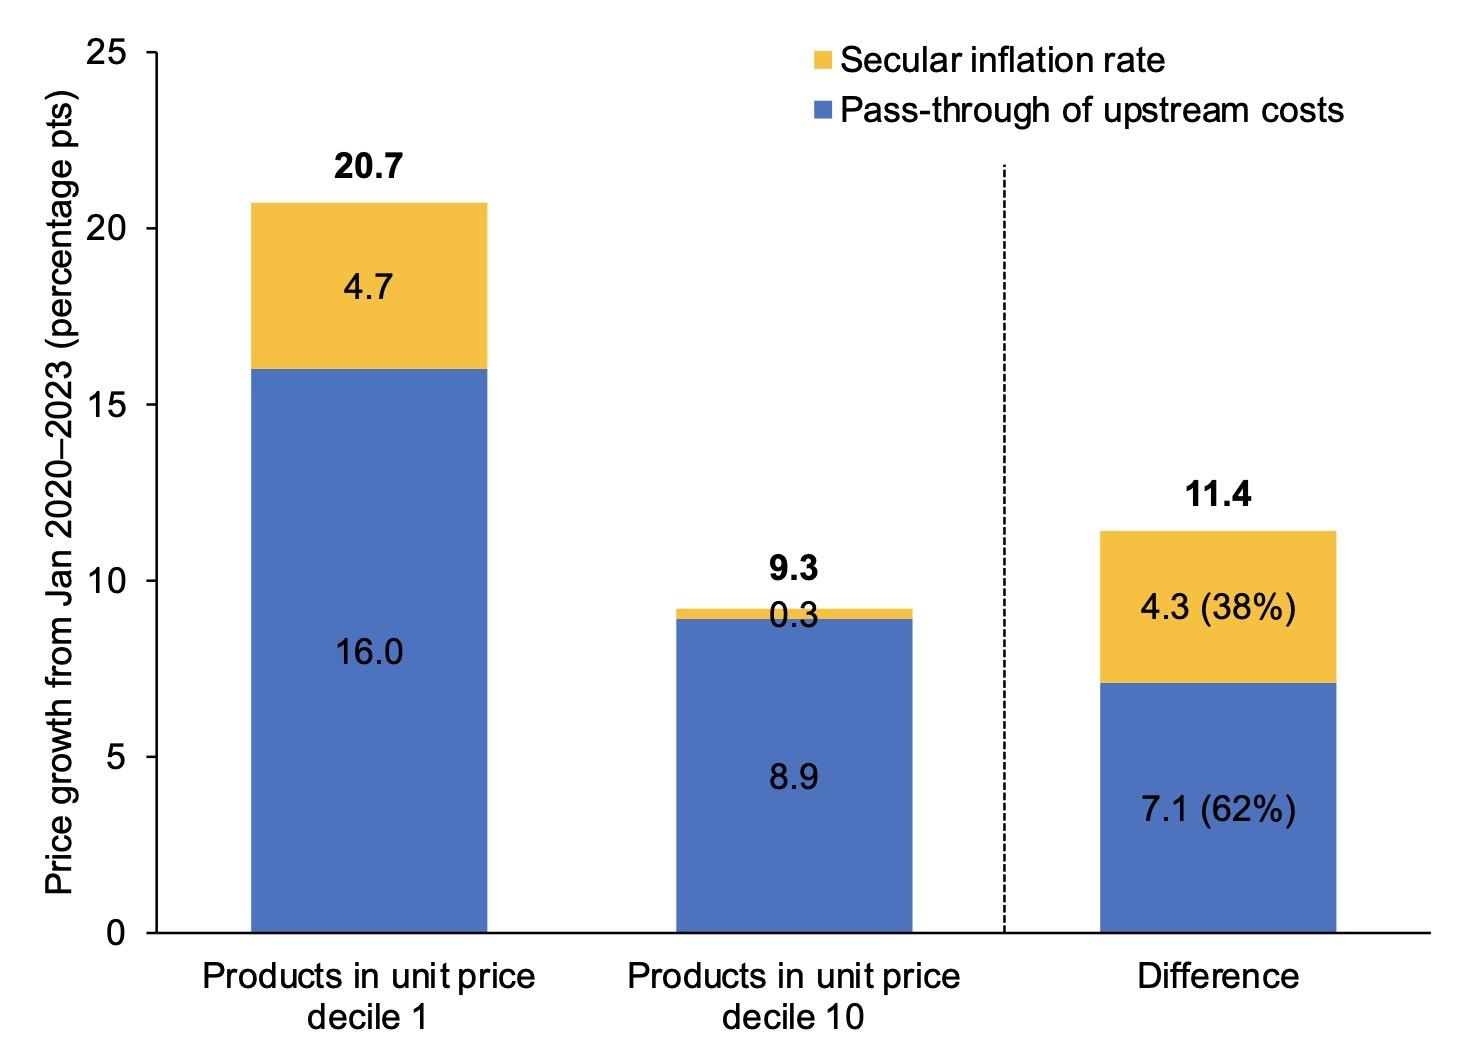
Figure 3 shows a stark contrast in inflation projected for low- and high-end products from 2020–2023. During this period, the prices of products in the lowest decile of unit prices are estimated to have grown by over 20%, compared to about 9% for products in the highest decile of unit prices. Over 60% of this inflation gap stems from the fact that rising upstream costs lead to excessive inflation for low-price products.
Figure 3 Projected inflation for low- and high-unit price products from 2020–2023
Note: Figure 3 shows the projected average price growth for food-at-home products in the bottom and top deciles of unit prices in each product category. For products in each decile of unit price, quarterly inflation rates from 2006–2020 are regressed against a constant and four lags of food manufacturing producer price index inflation. Projected inflation rates are calculated by applying the fitted coefficients to food manufacturing PPI growth from 2020–2023. Price growth is decomposed into a component due to food manufacturing PPI pass-through (blue) and secular inflation (yellow).
These differences in product-level inflation rates also imply substantial differences in overall food-at-home inflation experienced by different income groups. I estimate prices for households in the lowest income quintile grew by 15.6%, compared to 13.7% for households in the highest income quintile. Of the 1.8 percentage point gap, an estimated two-thirds is due to the unequal pass-through of rising input costs.
Conclusion
These findings lend empirical support to recent claims that low-income households have experienced excessive inflation rates over the past few years. But they also cast doubt on some commonly offered explanations. For example, the fact that these patterns appear over the entire period from 2006–2020 indicate that the recent surge in inflation inequality is not due to disproportionate demand at the low-end, fuelled by pandemic government stimulus. Nor does it seem that supermarkets are taking advantage of the inflationary environment to ‘price gouge’ low-income customers.
Instead, the recent surge in inflation inequality stems from more innocuous roots. Firms pass rising upstream costs on to retail prices at similar absolute rates for both low- and high-end products. However, when price changes are measured in percentages, the increases appear disproportionately large for low-end products. This pattern has real consequences for consumers across the income distribution, since rising input prices can lead the cost of a typical shopping basket for a low-income household to grow faster than the cost of a high-income household’s shopping basket. From 2020–2023, these differences add up to a substantial inflation gap for low- and high-income households.
References
Cavallo, A (2023), “Inflation with Covid consumption baskets”, IMF Economic Review, 1–16.
Ciccarelli, M, F Kuik and C M Hernández (2023), “The outlook is mixed: The asymmetric effects of weather shocks on inflation”, VoxEU.org, 23 October.
Handbury, J (2021), “Are poor cities cheap for everyone? Non-homotheticity and the cost of living across U.S. cities”, Econometrica 89(6): 2679–715.
Hochmuth, P, M Pettersson and C J Weissert (2023), “A nonhomothetic price index and cost-of-living inequality”, working paper.
Jaravel, X (2019), “The unequal gains from product innovations: Evidence from the U.S. retail sector”, The Quarterly Journal of Economics 134(2): 715–83.
Jaravel, X (2021), “Inflation inequality: Measurement, causes, and policy implications”, Annual Review of Economics 13: 599–629.
Jaravel, X (2022), “Inflation and inequality”, presentation at the New York Federal Reserve, 4 November.
Kaplan, G and S Schulhofer-Wohl (2017), “Inflation at the household level”, Journal of Monetary Economics 91: 19–38.
Nakamura, E and D Zerom (2010), “Accounting for incomplete pass-through”, The Review of Economic Studies 77(3): 1192–230.
Office of National Statistics (2022), "Tracking the price of the lowest-cost grocery items, UK, experimental analysis, April 2021 to September 2022".
Rijkers, B, G Falcone, G Porto and E Artuc (2022), “War-induced food price inflation imperils the poor”, VoxEU.org, 1 April.
Sangani, K (2023), “Pass-through in levels and the unequal incidence of commodity shocks”, working paper.
Sangani, K (2023b), “Markups across the income distribution: Measurement and implications”, working paper.
Soldani, E, O Causa and N Luu (2023), “The cost-of-living squeeze: Distributional implications of rising inflation”, VoxEU.org, 24 April.

