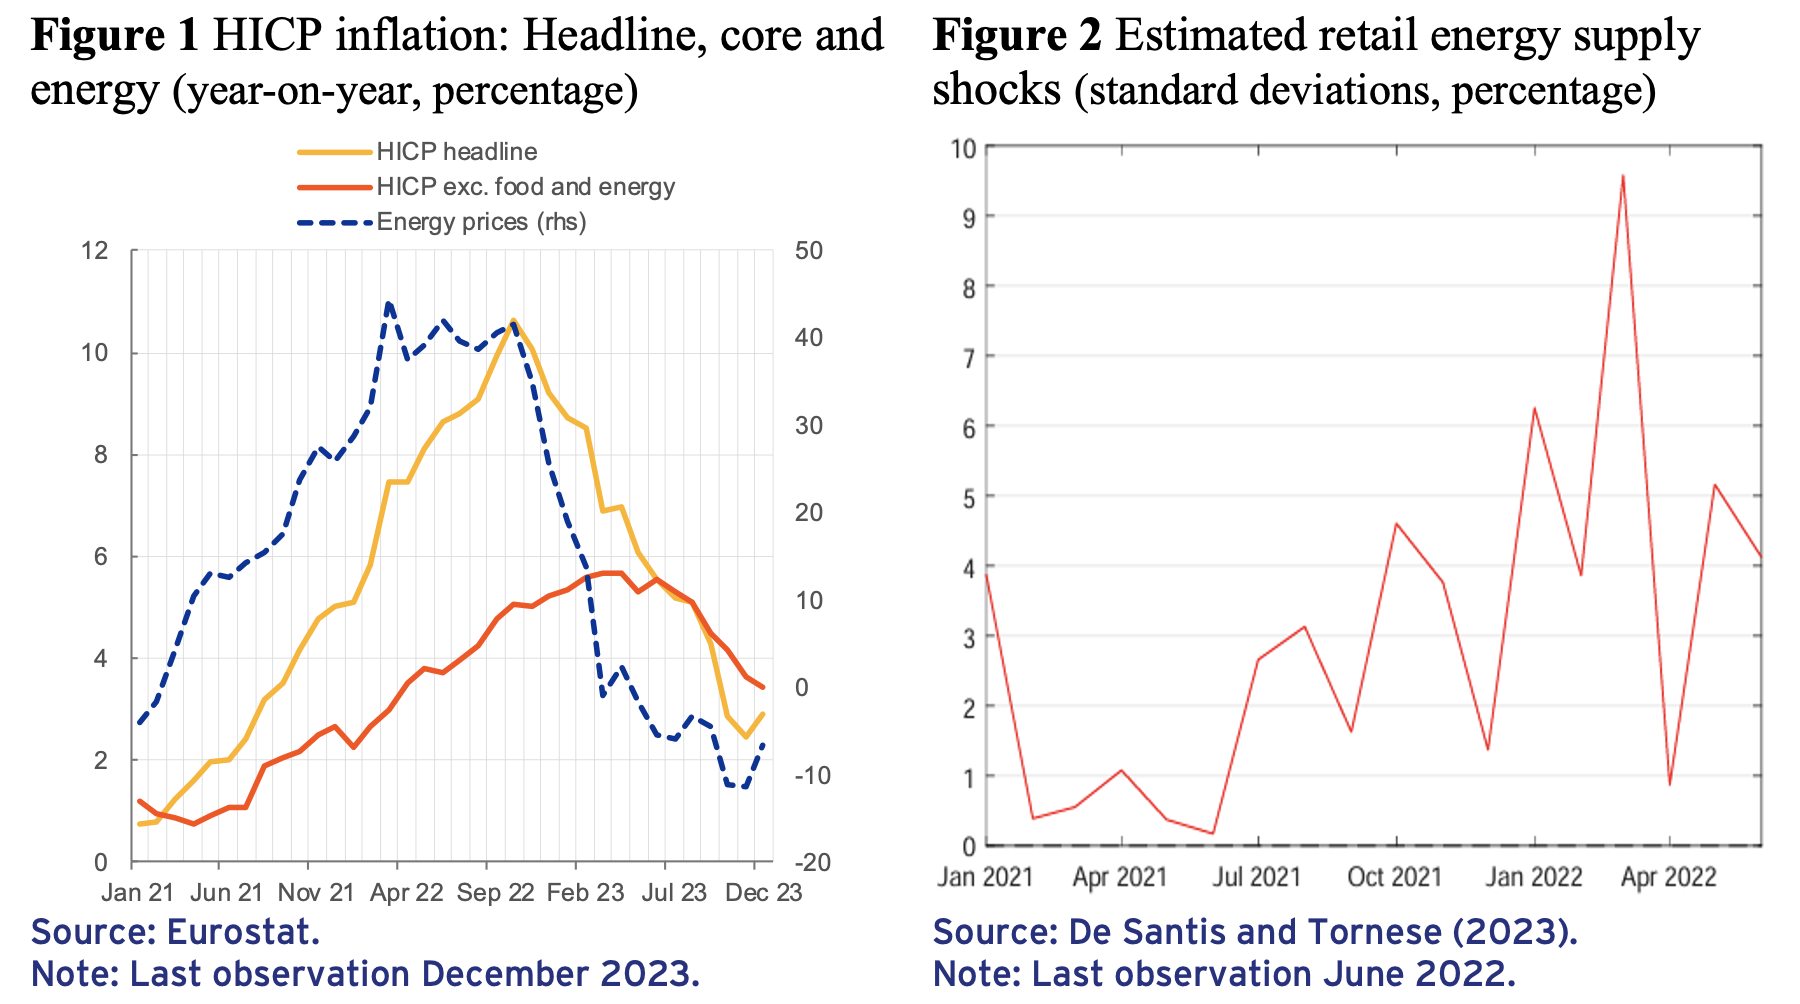
The fluctuations in consumer prices in 2022 and 2023 have been unprecedented since the creation of the Economic and Monetary Union (EMU). The Harmonized Index of Consumer Prices (HICP) in the euro area started to increase rather sharply since the end of summer 2021 (see Figure 1), when the surge in energy prices, coupled with both the effects of reopening following the removal of COVID-related restrictions and the effects of global supply bottlenecks, led to unprecedented increases in HICP inflation, which was then transmitted to core inflation.
A rise in HICP inflation can be due to the size of shocks, which by definition is unexpected, but also due to a change in the transmission mechanism of the same shocks, which instead can be evaluated ex ante. This can be illustrated with a simple mathematical relationship between headline inflation (Y) and energy prices (X), e.g.: Y = alpha*X. The sharp increase in headline inflation can be due to an unexpected sharp rise in energy prices (X) and to changes in the transmission mechanism (alpha), which can be calculated ex ante. In our recent work (De Santis and Tornese 2023), using nonlinear methods, we find that the transmission of energy supply shocks to consumer prices (alpha) is stronger in high-inflation regimes.
The size of the retail energy supply shocks in 2022 is estimated to be massive. We estimate extremely large energy supply shocks between July 2021 and June 2022. The median shocks amounting to 3.9 standard deviations on average each month, with the largest increase (10 standard deviations !!!) realised in March 2022 with the war in Ukraine (see Figure 2). In normal times, adverse energy supply shocks do not exceed 1 standard deviation. It is worth pointing out that the literature has often focused on the identification of oil supply shocks, while the energy crisis in 2021 and 2022 was driven by the unprecedented increase in gas and electricity prices, which are weakly correlated with crude oil prices.
We address this challenge using the energy component of HICP, which is an aggregate retail price index that includes electricity, gas, liquid fuels, solid fuels, heat energy, and fuels and lubricants for personal transport equipment.
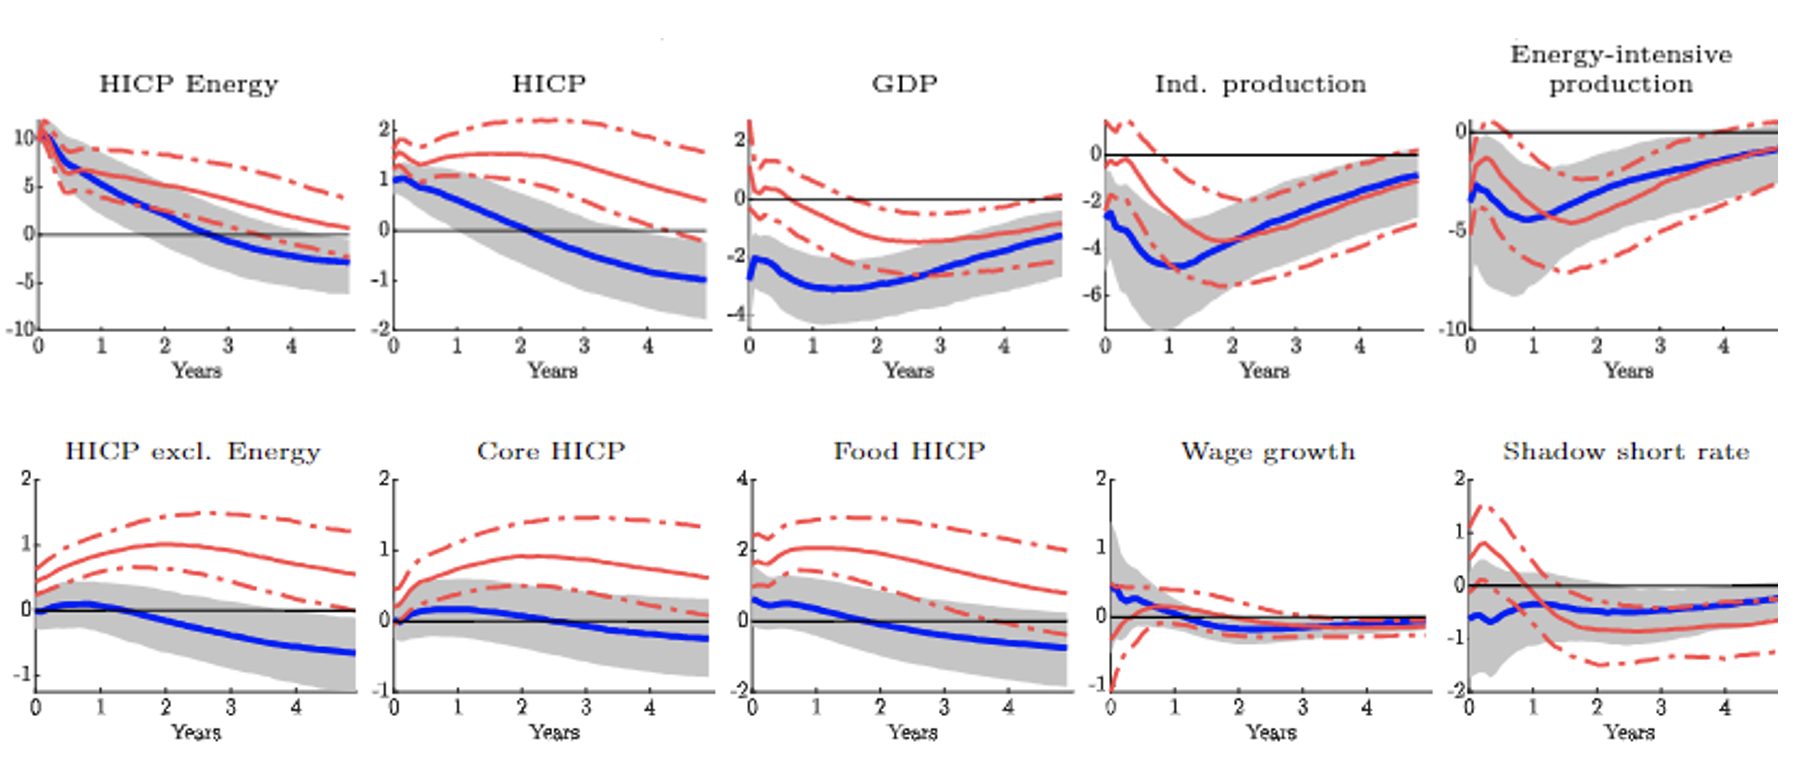
We also find that the transmission of the retail energy supply shocks is stronger and more persistent in the high-inflation regime. The passthrough of energy supply shocks to headline inflation and core inflation is stronger when underlying inflation is relatively high (see Figure 3, red areas). Moreover, the effect is much more persistent. Food prices are by far the most affected component. The response of various measures of inflation after an energy supply shock suggests that the transmission of the shocks depends on the state of the economy. The results also suggest that the policy rate (measured by the shadow short rate)
increases immediately in the high-inflation regime, but drops after about half a year following the decline in economic activity (see Figure 3). The persistence of higher headline and core consumer prices in the high-inflation regime might be related to the drop in the policy rate. These findings also apply to cases when energy supply shocks are favourable. In this situation, the decline in consumer inflation should be expected to be larger and more persistent than suggested by linear models.
The higher increase in consumer prices (excluding energy) cushions the drop in output in the short term. Retail energy supply shocks in high-inflation regimes have a very limited impact on GDP and industrial production in the short term (see Figure 3). The adverse impact materialises in the medium term with manufacturing being more adversely affected than GDP, given the lion’s share of less energy-intensive services in the value added of the euro area economy.
Figure 3 Nonlinear response of prices and output to retail energy supply shocks (percent)
Source: De Santis and Tornese (2023).
Notes: The Threshold-VAR (TVAR) contains five variables: HICP energy, HICP, GDP, industrial production and industrial production of the energy-intensive sector. The identifying assumptions are collected in Table 1 of De Santis and Tornese (2023). Each panel shows the median impulse response functions (IRFs) and the corresponding posterior 68% credible sets (dashed red lines and shaded bands). The red (blue) lines of the TVAR model are associated to the high (low) inflation regime, defined as underlying inflation being above (below) 2% annualised. The model is estimated over the sample period January 1990 – June 2022.
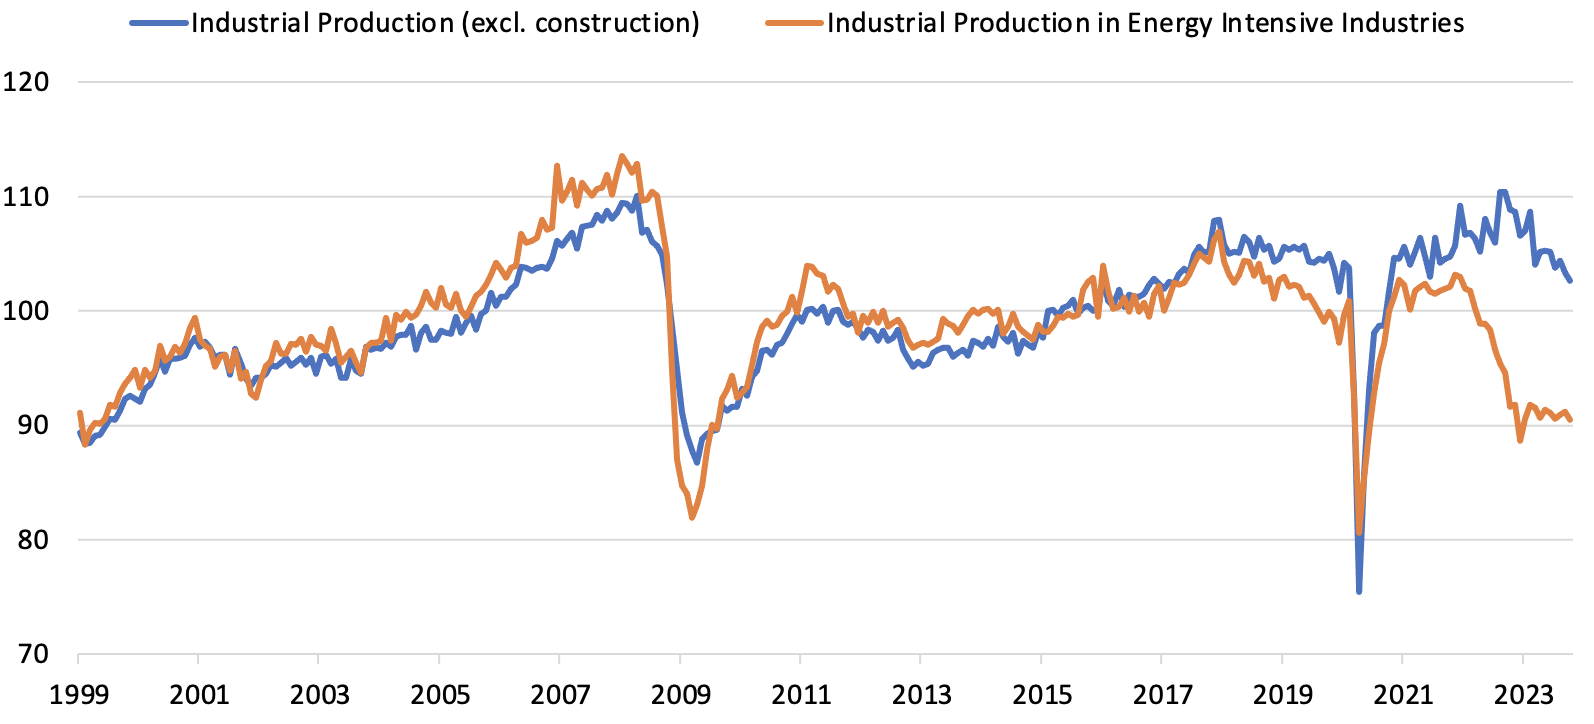
The results of the model suggest important negative repercussion for the energy-intensive sector, as the multipliers are more than twice as large relative to GDP. The energy-intensive sector, which is used in the model to identify the energy supply shock, is computed as a weighted average of the following industries, taking into account the time-varying size of each industry, as they are by far the largest-scale users of energy (EIA 2021, Gunnella et al. 2022): basic metals, metal products, chemicals and chemical products. The decoupling of the energy-intensive production vis-à-vis aggregate industrial production (excluding construction) is evident since the energy crisis started in the autumn of 2021 (see Figure 4), when the gas supply from Russia to the EU was cut, which contributed to the slow replenishment of gas inventories in Europe ahead of the winter season and, as a result, energy prices rose. There is a high risk of a permanent drop in the production of the European energy-intensive sectors, such as chemicals and basic metals, if the energy crisis is not resolved.
Figure 4 Euro area industrial production (excluding construction) and in energy-intensive industries (2015 = 100)
Source: Eurostat and own calculations.
Notes: Industrial production in energy intensive Industries is computed using a weighted average with time varying weights of the production in the following industries: basic metal, metal products, chemicals and chemical products.
The lower drop in GDP and industrial production recorded in the period of high inflation after an energy supply shock is due to the fact that many companies are able to make large profits in this state of the economy by rising the price of their goods more than the average costs.
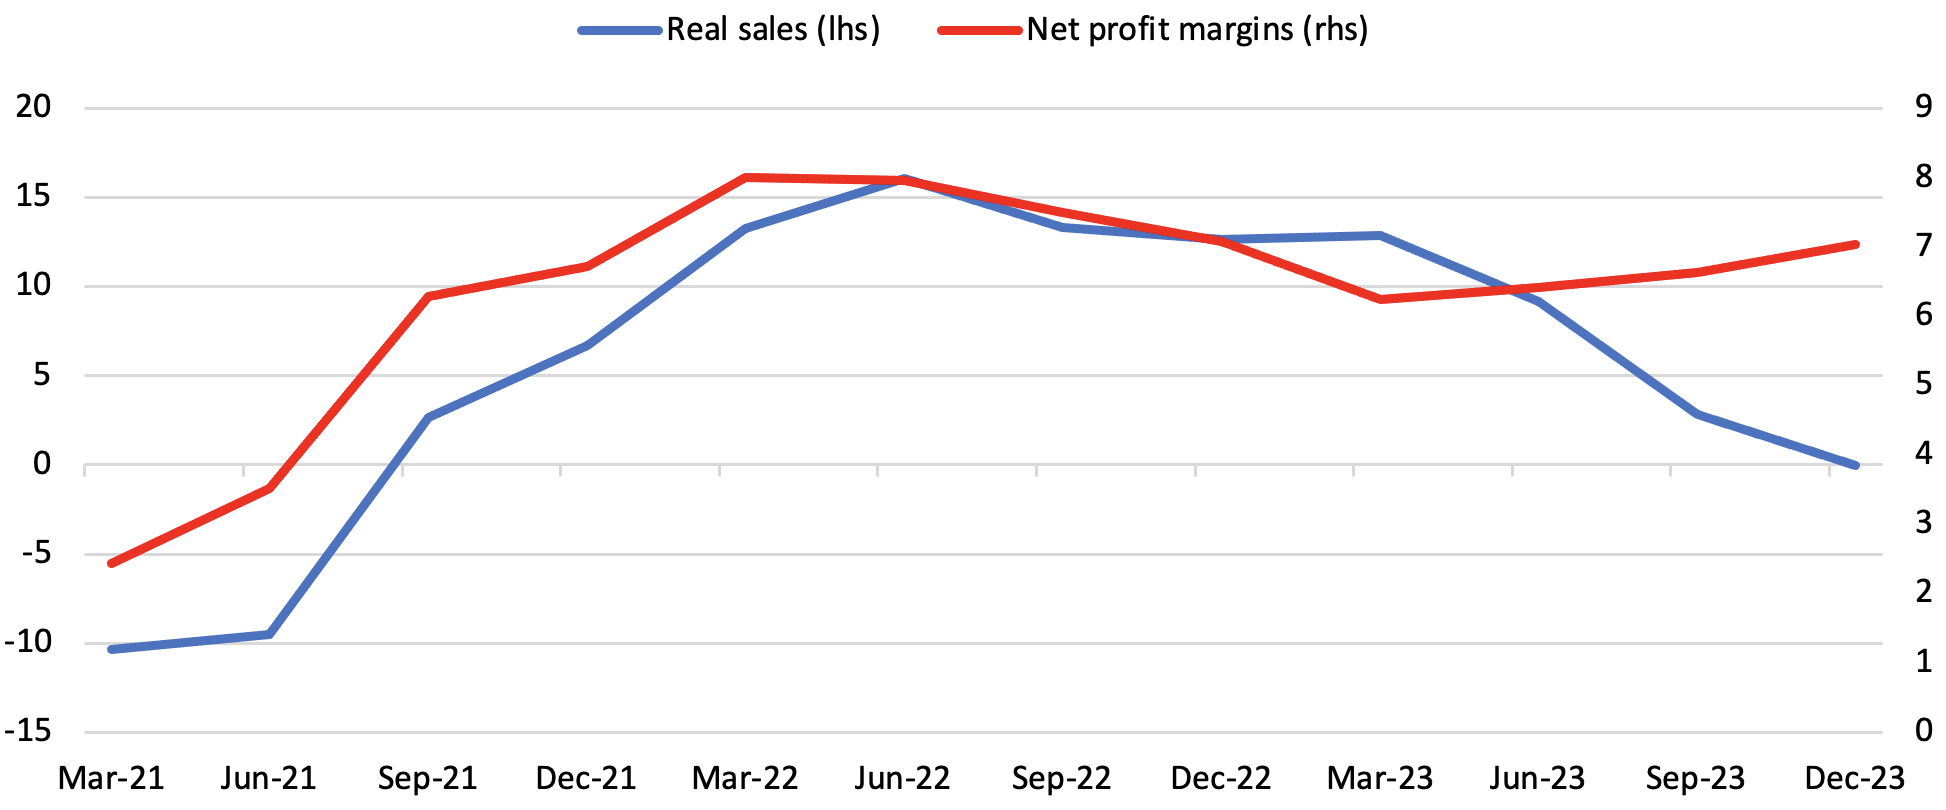
Based on data from Reuters, annual total sales of euro area listed companies increased by 19.3% in 2022 and 20.9% in 2023 relative to the previous year, while they dropped in 2021. They were strongly positive in real terms in 2022 and 2023 reaching 15% year-on-year in the summer 2022 (see Figure 5). Similarly, net profit margins (net profits divided by sales) jumped with the energy crisis to about 8% at the beginning of 2022 and fluctuated between 7% and 8% in 2022 and 2023. Also, the contribution of unit profits to domestic price pressures increased extraordinarily in 2022 (Arce et al. 2023). Consumer prices rise more than wages after an energy supply shock hits the economy unexpectedly when underlying inflation is high (see Figure 3), and this more than compensates for the rise in energy costs, especially for companies that have become more energy-efficient over the years. This implies a larger profit for companies, as they can easily convince agents in the short term that a rise in their price is required, given the potentially higher input costs to produce their own goods due to the higher inflation rate. The faster passthorough of energy supply shocks to consumer prices (excluding energy) with wage rigidity cushions the drop in output in the short term, leading to large profits and revenues.
Figure 5 Real sales and net profit margins of listed companies (quarterly, year-on-year, percent)
Source: Eurostat, Reuters and own calculations.
Notes: Real sales are computed by subtracting HICP inflation from nominal sales of listed companies. Net profit margins are defined as net profits divided by sales of listed companies.
The results are also informative for modelling the Phillips curve within dynamic stochastic general equilibrium (DSGE) models. Workhorse macroeconomic models used in many central banks and other policy institutions typically capture the price adjustment mechanism via the ‘Calvo’ approach whereby the repricing rate, which represents the degree of price flexibility in the economy, is constant. The Calvo approach could be a good approximation only when inflation is low and shocks are small. Our findings suggest that these models should allow for a nonlinear or state-dependent Phillips curve.
References
Arce, O, G Koester and C Nickel (2023), “One year since Russia’s invasion of Ukraine – the effects on euro area inflation”, ECB Blog, 24 February.
Bańbura, M, E Bobeica and C Martínez Hernández (2023), “What drives core inflation? The role of supply shocks”, ECB Working Paper No. 2875.
Bobeica, E, S Holton and G Koester (2023), “Bringing inflation back under control”, Intereconomics 58(3): 136–141.
De Grauwe, P and J Yuemei (2023), "Inflation then (1979-85) and now (2020-23): Why it is easier to fight inflation today”, VoxEU.org, 28 November.
De Santis, R A and T Tornese (2023) “Retail Energy Price Shocks’ Nonlinearities on Output and Prices”, ECB Working Paper No. 2834.
De Santis, R A (2024) “Supply Chain Disruption and Energy Supply Shocks: Impact on Euro Area Output and Prices”, International Journal of Central Banking and ECB Working Paper series, forthcoming.
EIA – Energy Information Administration (2021), "International Energy Outlook 2021: U.S. Department of Energy".
Gerinovics, R and L Metelli (2023), “The evolution of firm markups in the US and implications for headline and core inflation”, VoxEU.org, 18 December.
Gunnella, V, V Jarvis, R Morris, and M Toth (2022) “Natural gas dependence and risks to activity in the euro area,” ECB Economic Bulletin 1/2022.
Lutz, K and Z Xiaoqing (2023), “The inflationary impact of energy prices”, VoxEU.org, 10 February.
