Despite the shocks impacting the global economy and straining supply networks, there have been no clear signs of outright deglobalisation so far (Goldberg and Reed 2023, Baldwin 2022, Antràs 2021). Instead, recent data point to an ongoing decoupling between specific trade partners, mostly the US and China (Freund et al. 2023, Alfaro and Chor 2023). In this context, timely and state-of-the-art data to assess the prospect of global economic integration are key. While trade data might provide a first assessment on reshaping patterns of trade, indicators based on Inter-Country Input-Output (ICIO) tables are essential to unravel the complex structure of supply and demand linkages and assess how interconnections between economies are evolving, with a look-through perspective (Baldwin et al. 2022).
To capture the dynamics of global value chains (GVCs) and inform policymaking, scholars have developed various indicators and measures of GVC participation (see, among others, Hummels et al. 2001, Johnson and Noguera 2012, Koopman et al. 2014, Borin and Mancini 2023). A parallel body of work examines country and/or sectoral positioning within GVCs, evaluating whether a given country or industry specialises in relatively upstream or downstream activities towards final demand (see, among others, Antràs et al. 2012, Fally 2012, Antràs and Chor 2013). This perspective on production staging is crucial as it sheds light on factors influencing productivity differences, as well as geography and firm organisational decisions, emphasising that such choices are not solely determined by marginal costs.
A new global open access dataset of ready-to-use indicators of global value chains positioning
While common indicators of GVC participation are readily accessible to researchers through up-to-date open-access platforms like the World Bank's WITS GVC (Borin et al. 2021) and the OECD-TIVA datasets (OECD 2023) or software for more detailed analyses (Belotti et al. 2021), GVC positioning indicators are not as readily available. We have addressed this gap in the literature by creating a new global dataset of ready-to-use upstreamness and downstreamness indicators. These measures are computed following the methodologies outlined by Antràs et al. (2012), Fally (2012), and Antràs and Chor (2013, 2019), utilising the most recent data from widely used inter-country input-output tables, including Asian Development Bank (ADB) MRIO, EORA (Lenzen et al. 2013), OECD TiVA (OECD 2023), WIOD (Timmer et al. 2015), and Long-run WIOD (Woltjer et al. 2021). This GVC positioning dataset is frequently updated as timelier ICIO tables are released and covers a wide range of countries, including many developing nations, and sectors. It is openly accessible here.
The primary contribution of this work lies in its ability to facilitate qualitative and quantitative research activities for scholars working on the topic of global value chains and belonging to different research disciplines—economics, sociology, international economics, economic geography, international political economy, supply chain management, and international business. They can now explore the evolution of GVC positioning over time at both the country and industry levels and conduct international comparisons without the need for technical expertise or extensive matrix calculations.
Stylised facts, evolution, and comparability of global value chain positioning measures
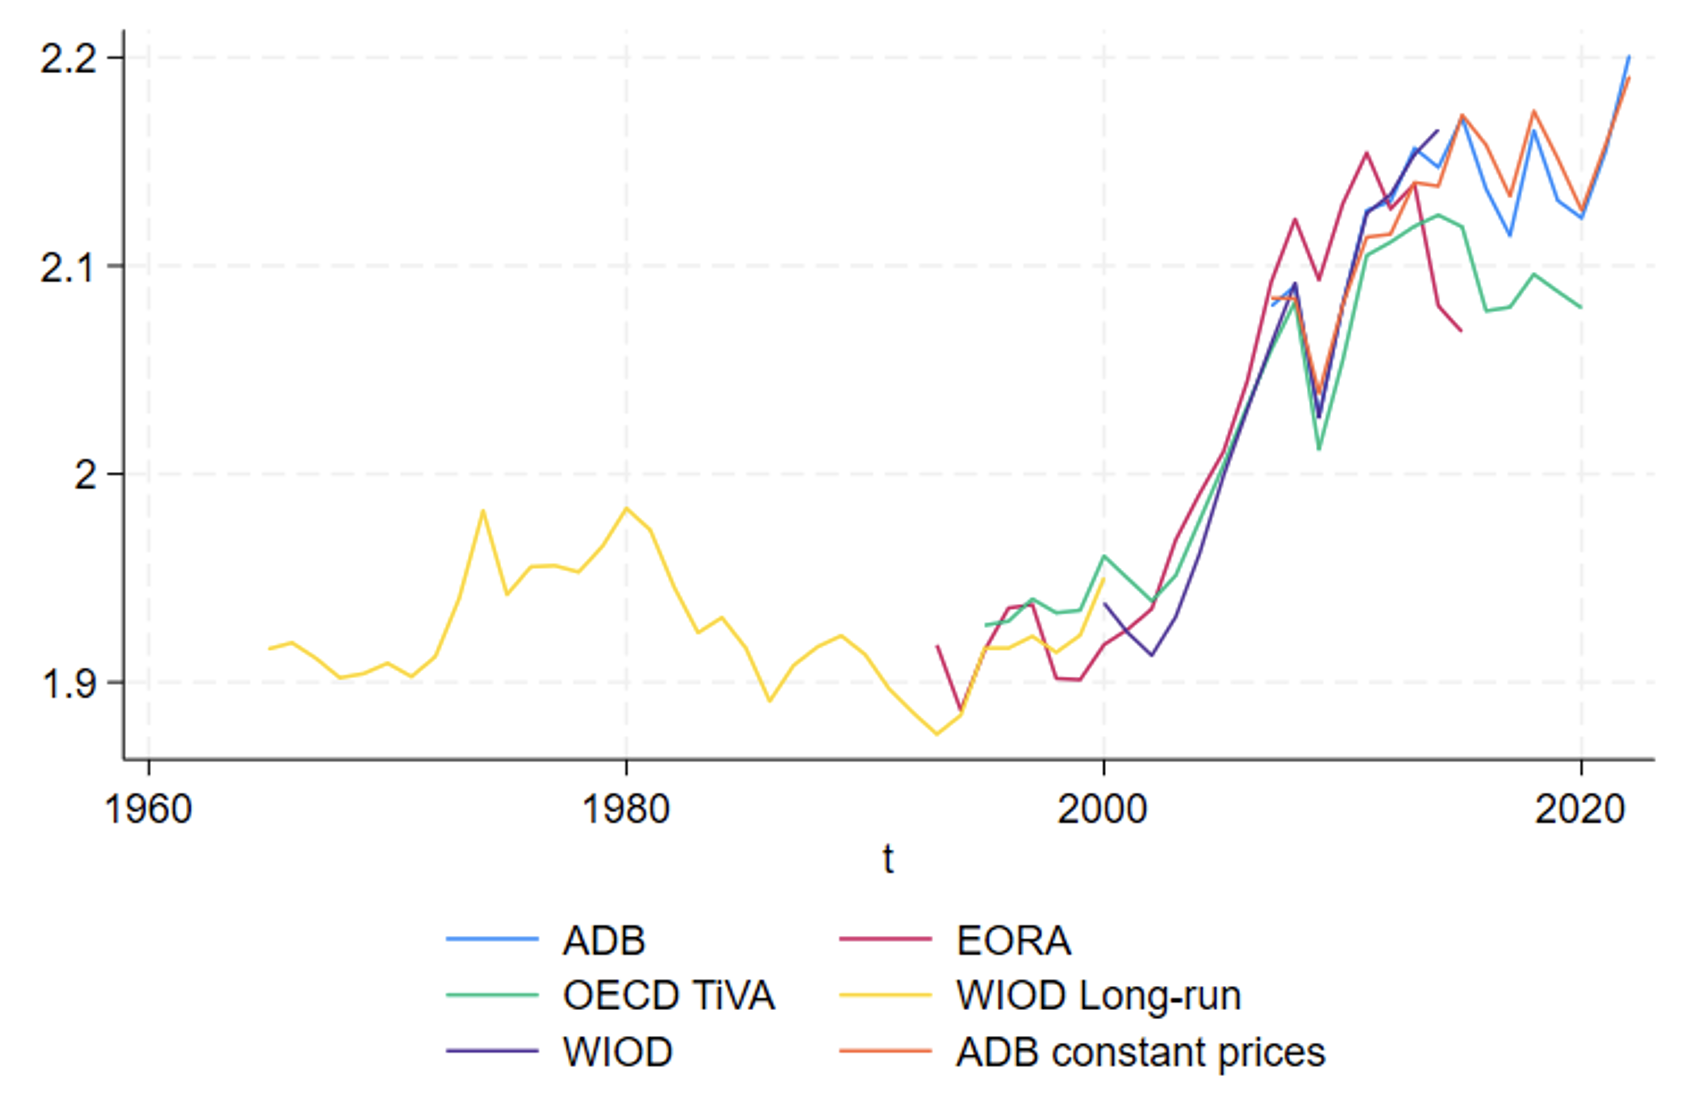
In Mancini et al. (2024), we explore this new GVC positioning dataset, presenting stylised facts and comparing the various ICIO data. Figure 1 provides a first overview of the GVC positioning indicators for the various ICIO datasets at the global level. Acknowledging that at the global aggregate level, upstreamness and downstreamness coincide and can be seen as a proxy for global production complexity (Antràs and Chor 2019), Figure 1 shows a common trend of increasing GVC complexity across all the datasets considered during the hyper-globalisation phase (1995–2008), followed by a 'slowbalisation' phase starting right after the Global Crisis. No signs of major drops in GVC complexity have been found in recent years across different datasets, despite global shocks and increases in protectionism and inward-looking policies. The post-2020 increase could even be a sign of GVCs lengthening as global trade patterns are reshaped by geopolitical tensions.
Figure 1 Trends in GVC complexity at the global level
Source: Mancini et al. (2024)
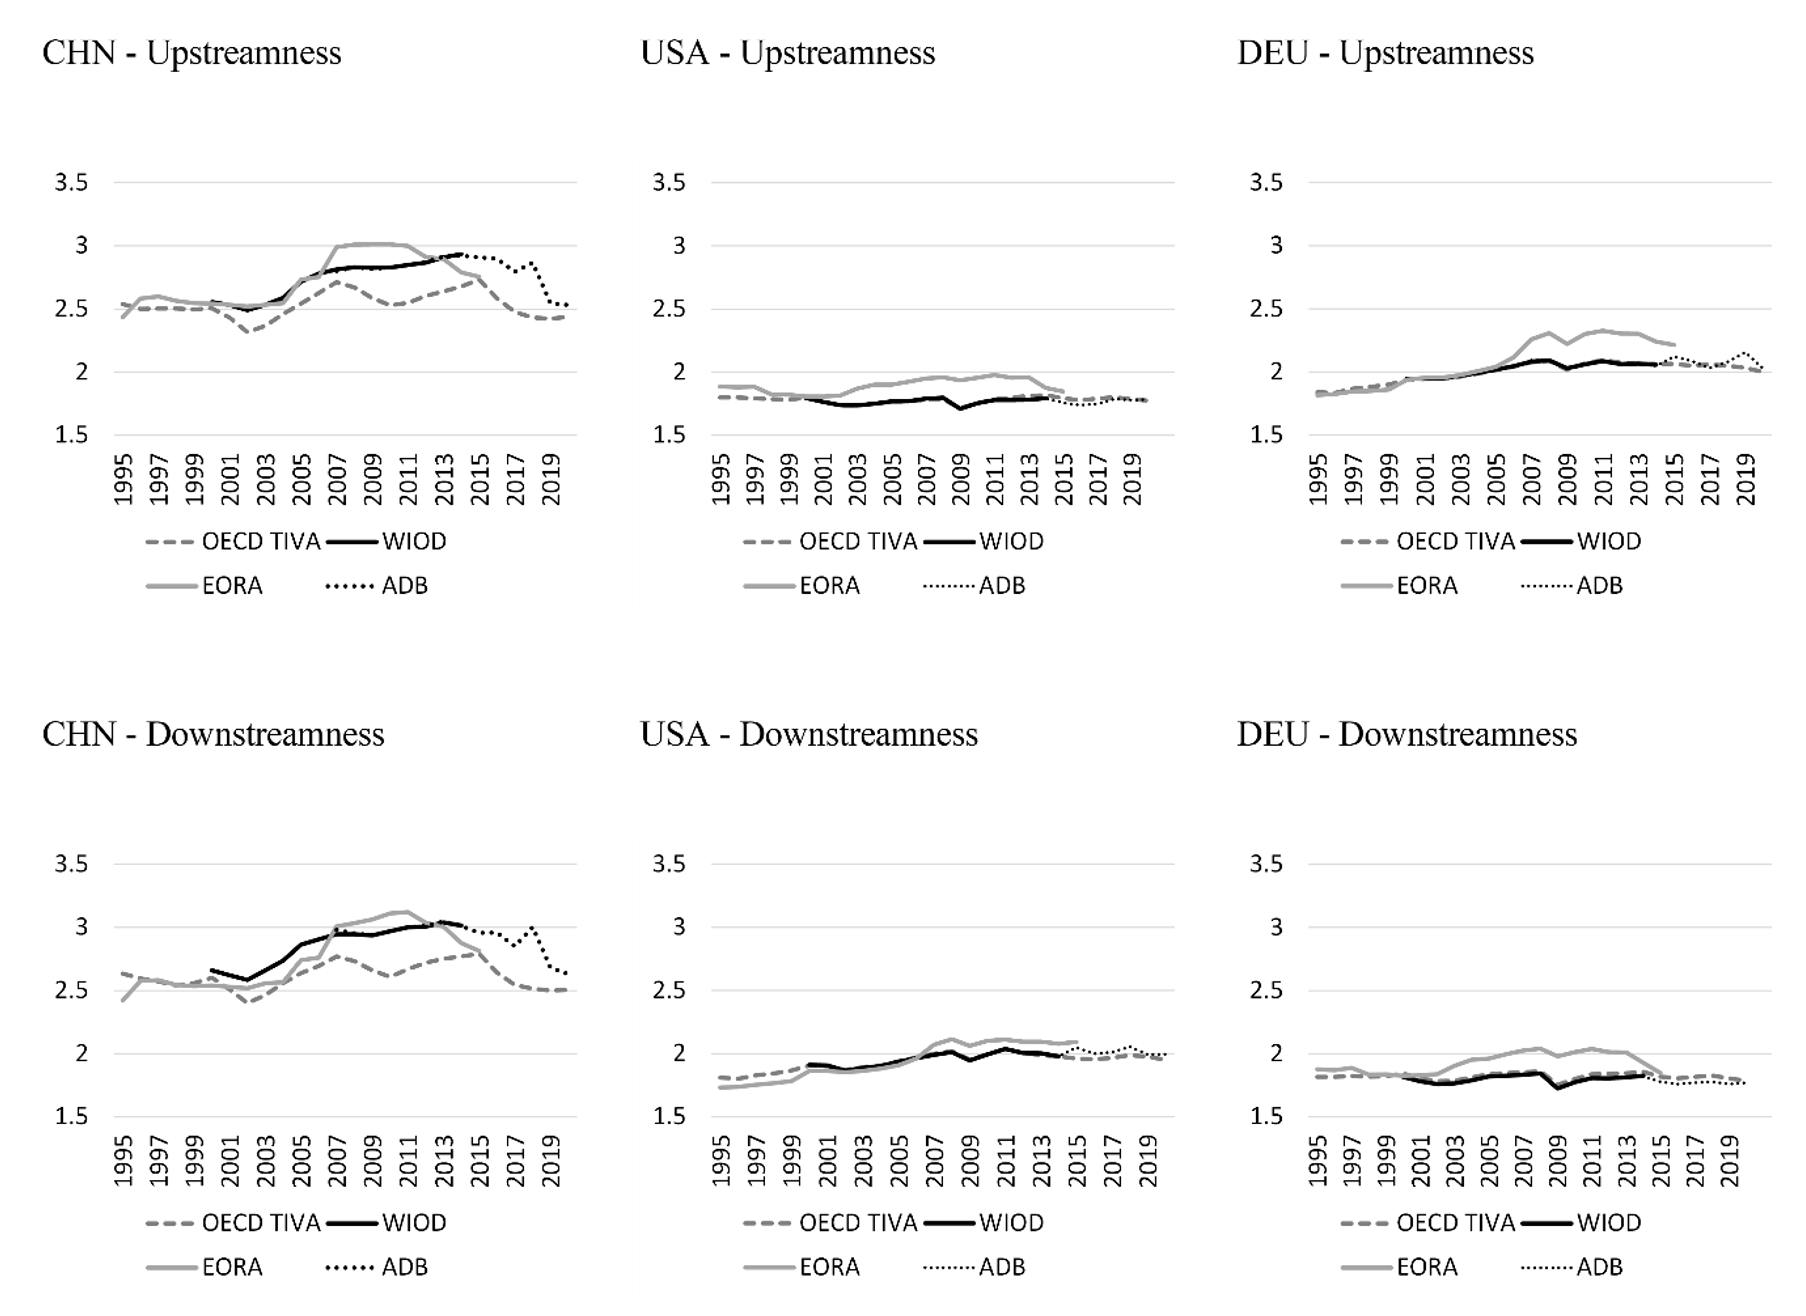
Measures of upstreamness and downstreamness computed on different ICIO tables exhibit a very strong correlation not only at the aggregate level, but also across countries. To gain insight into this, a comparative analysis of the dynamics of GVC positioning indicators for three key countries, namely China, Germany, and the US, is presented in Figure 2. Despite differences in the methodologies used and the statistics employed to derive the original ICIO tables, as well as differences in sectoral coverage, the level gaps and time trends for each country appear broadly consistent across datasets, albeit with some country-specific differences.
Figure 2 Comparing dynamics of GVC positioning across different datasets for China, Germany, and the US
Source: Mancini et al. (2024)
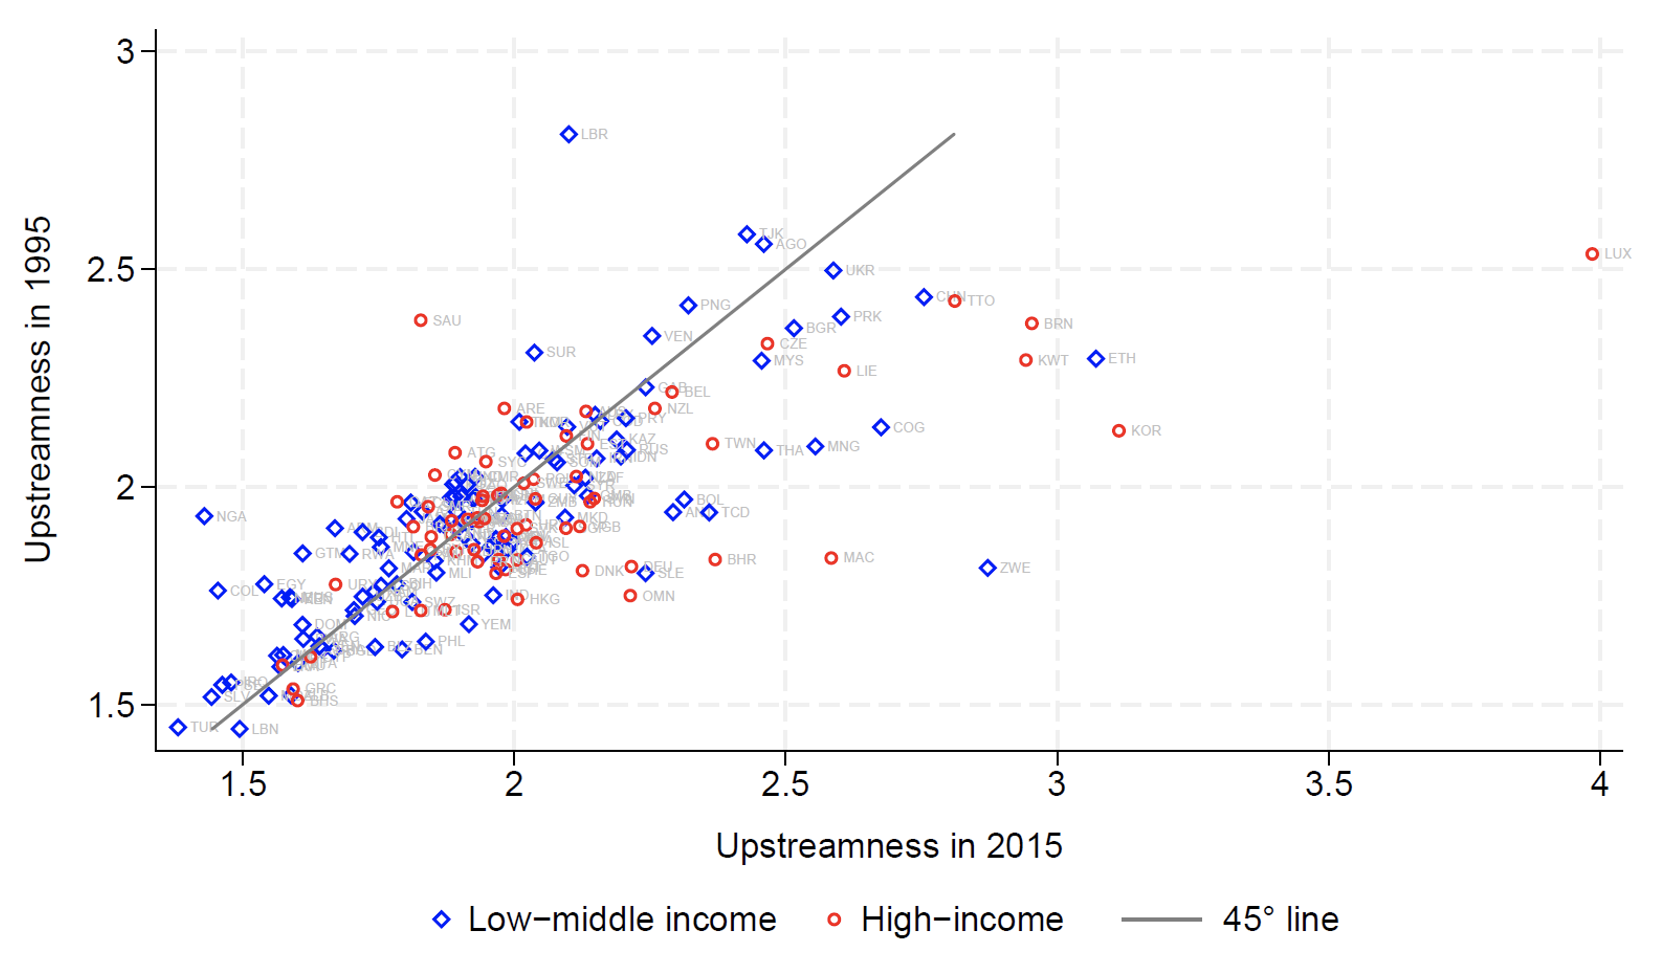
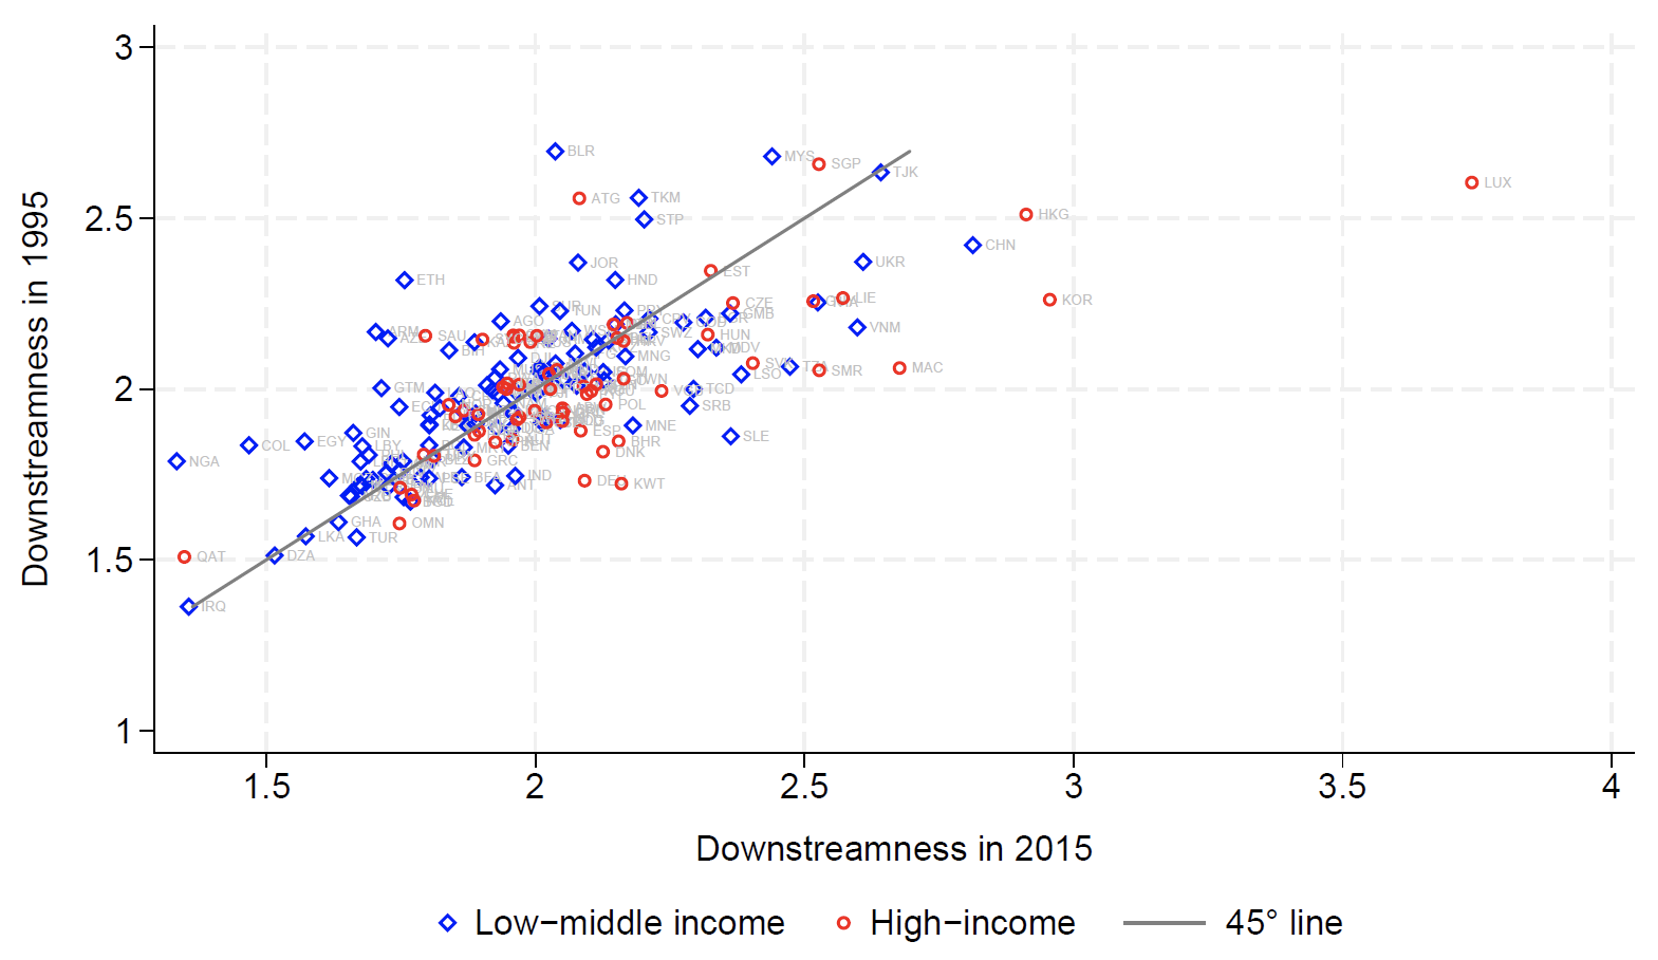
A snapshot of this evolution over time of both upstreamness and downstreamness by income group, is offered by Figure 3. It uses the EORA data, which encompasses the largest subgroups of low-income countries. Looking at the position of countries with respect to the 45 degrees line, it is possible to identify which countries have changed their relative position in GVCs over the period. Both upstreamness and downstreamness plots show that, in general, high-income economies have shifted their production toward sectors with a more extreme position.
Figure 3 Changes in GVC positioning by income group
Source: Mancini et al. (2024)
Additional insights for the empirical analysis can be gleaned from assessing the dynamics of the indicators by sectors.
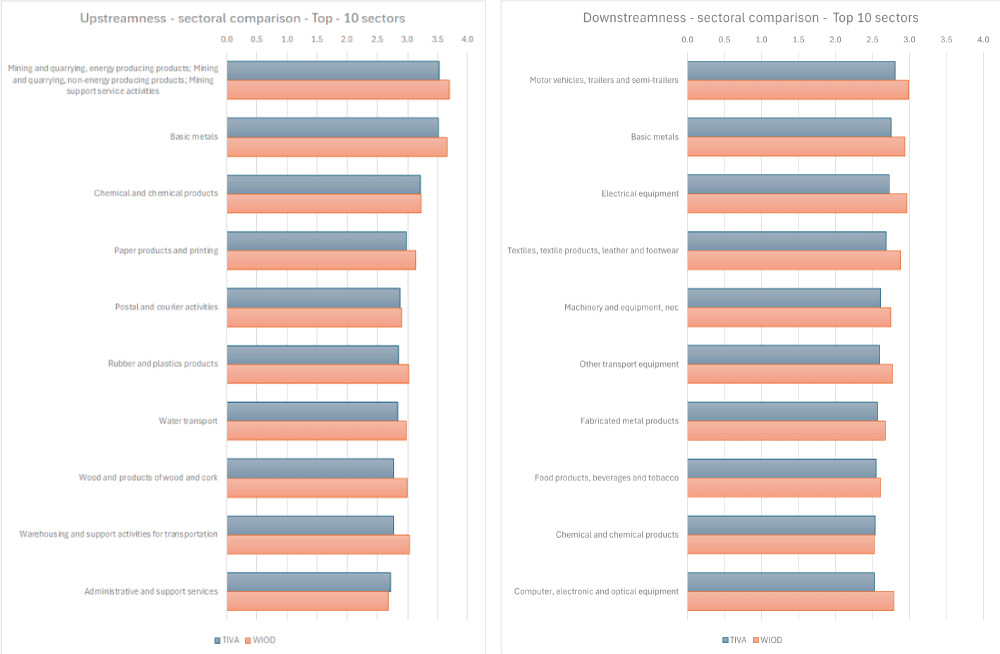
To this end, Figure 4 provides a snapshot of sectoral comparisons of upstreamness and downstreamness indicators between WIOD and OECD TiVA datasets for the top ten most upstream and downstream sectors. It again highlights a noteworthy level of consistency in the GVC positioning indicators between the two datasets. All manufacturing sectors exhibit greater chain length in relation to both endpoints of the production chains, typically indicating an average of two stages of production away from each endpoint. This trend remains consistent across manufacturing sectors, exhibiting relatively limited cross industry variation. In both datasets, the most upstream sectors are Mining and Quarrying, and Basic Metals, two sectors usually involved in the first stages of GVCs. Basic Metals are also listed alongside Motor Vehicles and Electrical Equipment as some of the most downstream industries. This is consistent with Antràs and Chor’s (2019) puzzling correlation and, in this case, is also influenced by the relatively high level of sector aggregation.
Figure 4 Sectoral dynamics in GVC positioning
Source: Mancini et al. (2024)
Conclusions
The dataset discussed in this column holds the potential to greatly facilitate research efforts concerning the analysis of GVCs and production networks. Scholars, practitioners, and policymakers could benefit from its extensive country coverage, including developing and emerging economies, as well as its detailed sectoral breakdown and historical perspective on GVC positioning over time. Such features would enhance both qualitative and quantitative evidence regarding the complexities of GVC dynamics at the aggregate, country, and sector-specific levels, offering a truly global perspective.
Authors’ note: This column does not necessarily reflect the views of the Bank of Italy.
References
Alfaro, L and D Chor (2023), "A perspective on the great reallocation of global supply chains", VoxEU.org, 28 September.
Antràs, P, D Chor, T Fally and R Hillberry (2012), “Measuring the Upstreamness of Production and Trade Flows”, American Economic Review Papers & Proceedings 102(3): 412–16.
Antràs, P and D Chor. (2013), “Organising the Global Value Chain”, Econometrica 81(6): 2127–204.
Antràs, P and D Chor (2019), “On the Measurement of Upstreamness and Downstreamness in Global Value Chains”, In L Y Ing and M Yu (eds.), World Trade Evolution: Growth, Productivity and Employment, 126–94, London and New York: Routledge.
Antràs, P (2021), “De-globalisation? Global value chains in the post-COVID-19 age”, NBER Working Paper 28115.
Baldwin, R (2022), “The peak globalisation myth: Part 3”, VoxEU.org, 2 September.
Baldwin, R, R Freeman and A Theodorakopoulos (2022), “Horses for Courses: Measuring Foreign Supply Chain Exposure”, NBER Working Paper 31820.
Belotti, F, A Borin and M Mancini (2021), “icio – Economic Analysis with InterCountry Input-Output tables”, The Stata Journal (21)3.
Borin, A and M Mancini (2023), “Measuring What Matters in Value-added Trade”, Economic Systems Research 35(4): 586–613.
Borin, A, M Mancini and D Taglioni (2021), “Economic Consequences of Trade and Global Value Chain Integration: A Measurement Perspective”, World Bank Policy Research Working Paper no. 9785.
Fally, T (2012), “Production Staging: Measurement and Facts”, Unpublished manuscript, University of California, Berkeley, CA, USA.
Freund, C, A Mattoo, A Mulabdic and M Ruta (2023), “US-China decoupling: Rhetoric and reality”, VoxEU.org, 31 August.
Goldberg, P K and T Reed (2023), “Is the Global Economy Deglobalizing? And If So, Why? And What is Next?”, Brookings Papers on Economic Activity, Spring.
Hummels, D, J Ishii and K M Yi (2001), “The Nature and Growth of Vertical Specialization in World Trade”, Journal of International Economics 54: 75–96.
Koopman, R, Z Wang and S Wei (2014), “Tracing Value-Added and Double Counting in Gross Exports”, American Economic Review 104(2): 459–94.
Mancini, M, P Montalbano, S Nenci and D Vurchio (2024), “Positioning in Global Value Chains: World Map and Indicators, a New Dataset Available for GVC Analyses”, The World Bank Economic Review, lhae005.
Johnson, R C and G Noguera (2012), “Accounting for Intermediates: Production Sharing and Trade in Value Added”, Journal of International Economics 86(2): 224–36.
Lenzen, M, D Moran, K Kanemoto and A Geschke (2013), “Building Eora: A Global Multi-regional Input-Output Database at High Country and Sector Resolution”, Economic Systems Research 25(1): 20-49.
OECD (2023), TiVA User guide.
Timmer, M P, E Dietzenbacher, B Los, R Stehrer and G J de Vries (2015), “An Illustrated User Guide to the World Input-Output Database: the Case of Global Automotive Production”, Review of International Economics 23: 575–605.
Woltjer, P, R Gouma and M P Timmer (2021), "Long-run World Input-Output Database: Version 1.1 Sources and Methods", GGDC Research Memorandum 190.


