That Europe is lagging in innovation has been diagnosed for a long time. More than a decade ago, the EU launched the Innovation Union, and increasing expenditure on R&D to 3% of GDP has been an official goal since the launch the Lisbon Strategy in 2000. However, gross domestic expenditure on R&D in the EU is still below 2% of GDP, lower than in other major economies such as the US, Japan, and China.
The reason why the EU lags behind other regions is not that governments (national and EU) spend less on R&D than its rivals. In 2020, government-funded R&D amounted to €110 billion in the EU (mostly by national governments) and €150 billion in the US, accounting for a very similar percentage of GDP (around 0.7%) and higher than in many other regions of the world.
The key reason for the overall transatlantic difference is the lower engagement in R&D by the business sector, whose spending amounts to only 1.2% of GDP in the EU, versus 2.3% of GDP in the US. These often-cited OECD figures, however, do not allow for a sectorial breakdown.
To analyse in more detail the sectoral composition of R&D, in our recent paper (Fuest et al. 2024), we use data from the EU Industrial R&D Scoreboard, which are based on the accounts of the 2,500 largest companies in the world in terms of R&D spending.
Europe’s middle technology specialisation
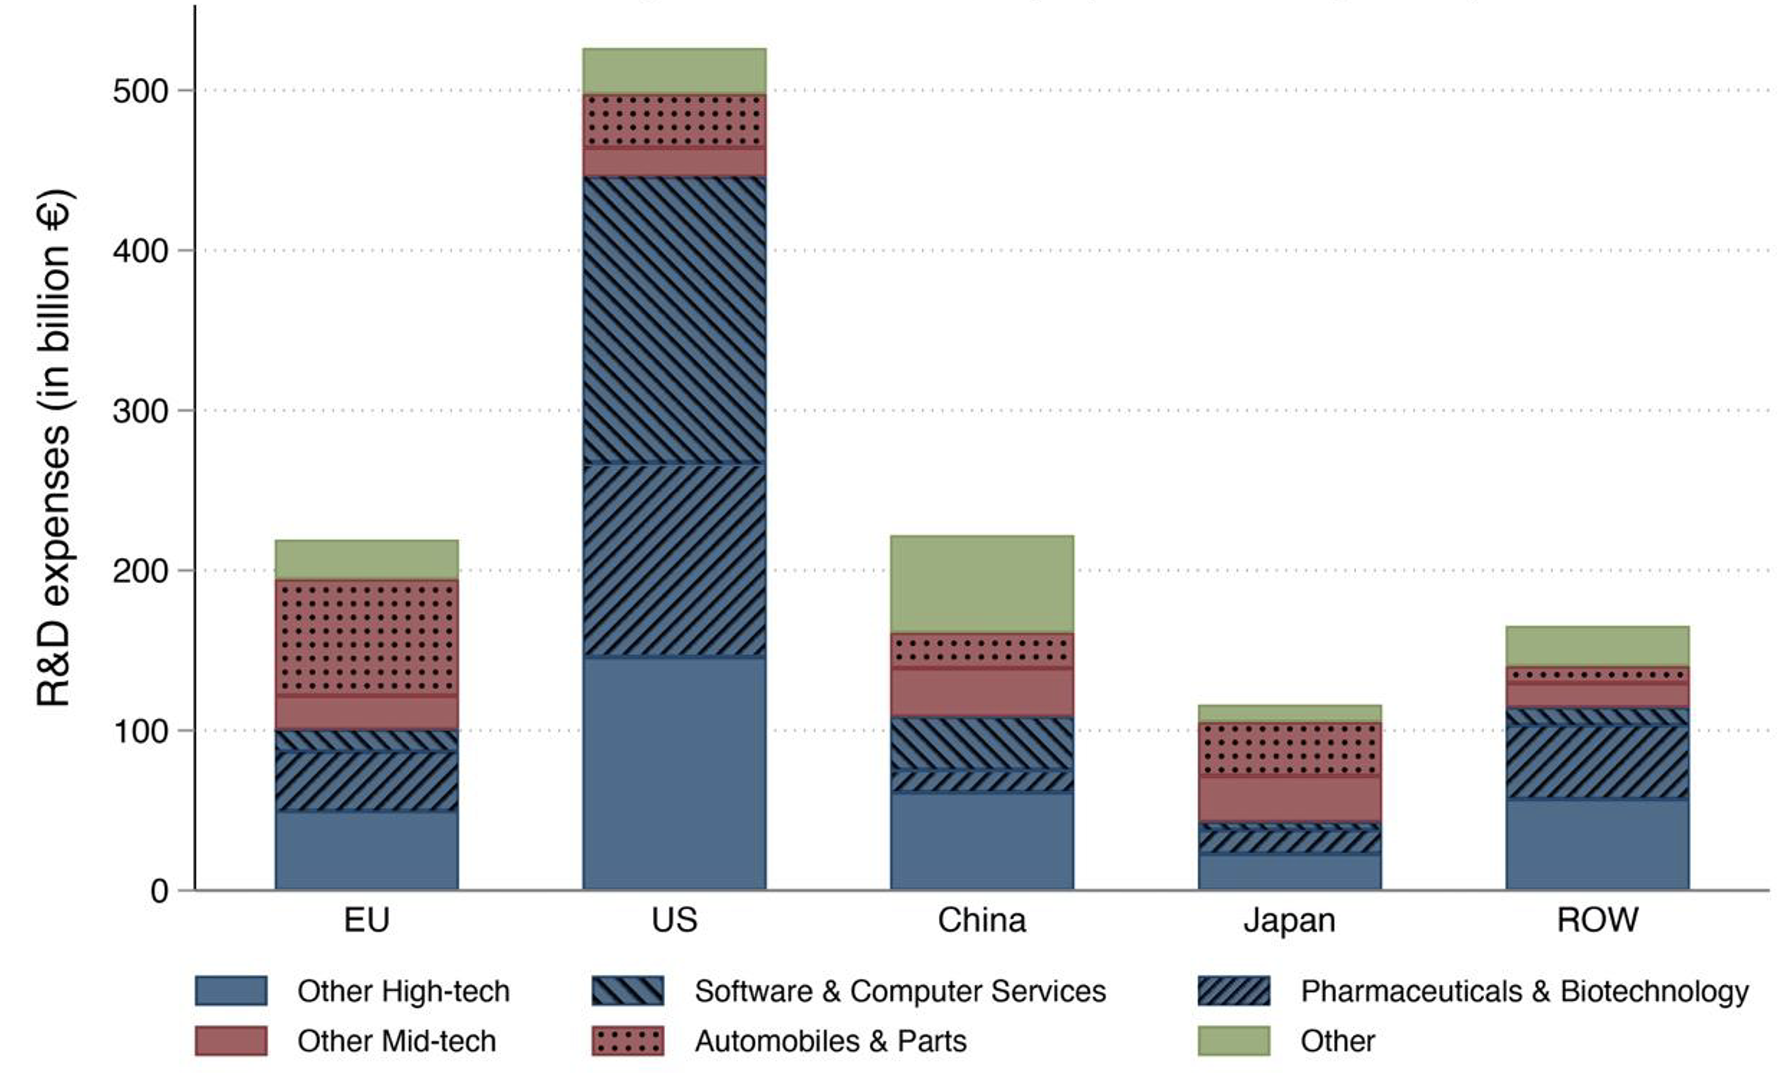
Figure 1 shows the sectoral composition of business R&D spending (BERD) in nominal terms for businesses headquartered in the four regions plus a residual, the rest of the world (ROW). In the US, high-tech industries – mostly software & computer services and pharmaceuticals & biotechnology – account for 85% of BERD. In the EU, by contrast, mid-tech industries – especially automobiles & parts – account for roughly 50% of BERD, a much higher share than in the US.
The sectoral composition of corporate R&D spending by EU-headquartered firms is more similar to that of Japan and China than the US.
Figure 1 BERD by technology level, top 2,500 companies
Source: Industrial R&D Investment Scoreboard (2023).
Not surprisingly, high-tech industries are much more R&D-intensive than mid-tech industries. Therefore, the larger share of high-tech industries in the US is a key factor explaining why BERD is so much higher than in other economies. What is more, evidence suggests that public-sector support is more likely to crowd out business R&D in low R&D-intensity industries (e.g. Marino et al. 2016, Szücs 2020), which might explain the low business-sector multiplier in the EU relative to the US.
Europe’s middle technology specialisation is permanent – a trap?
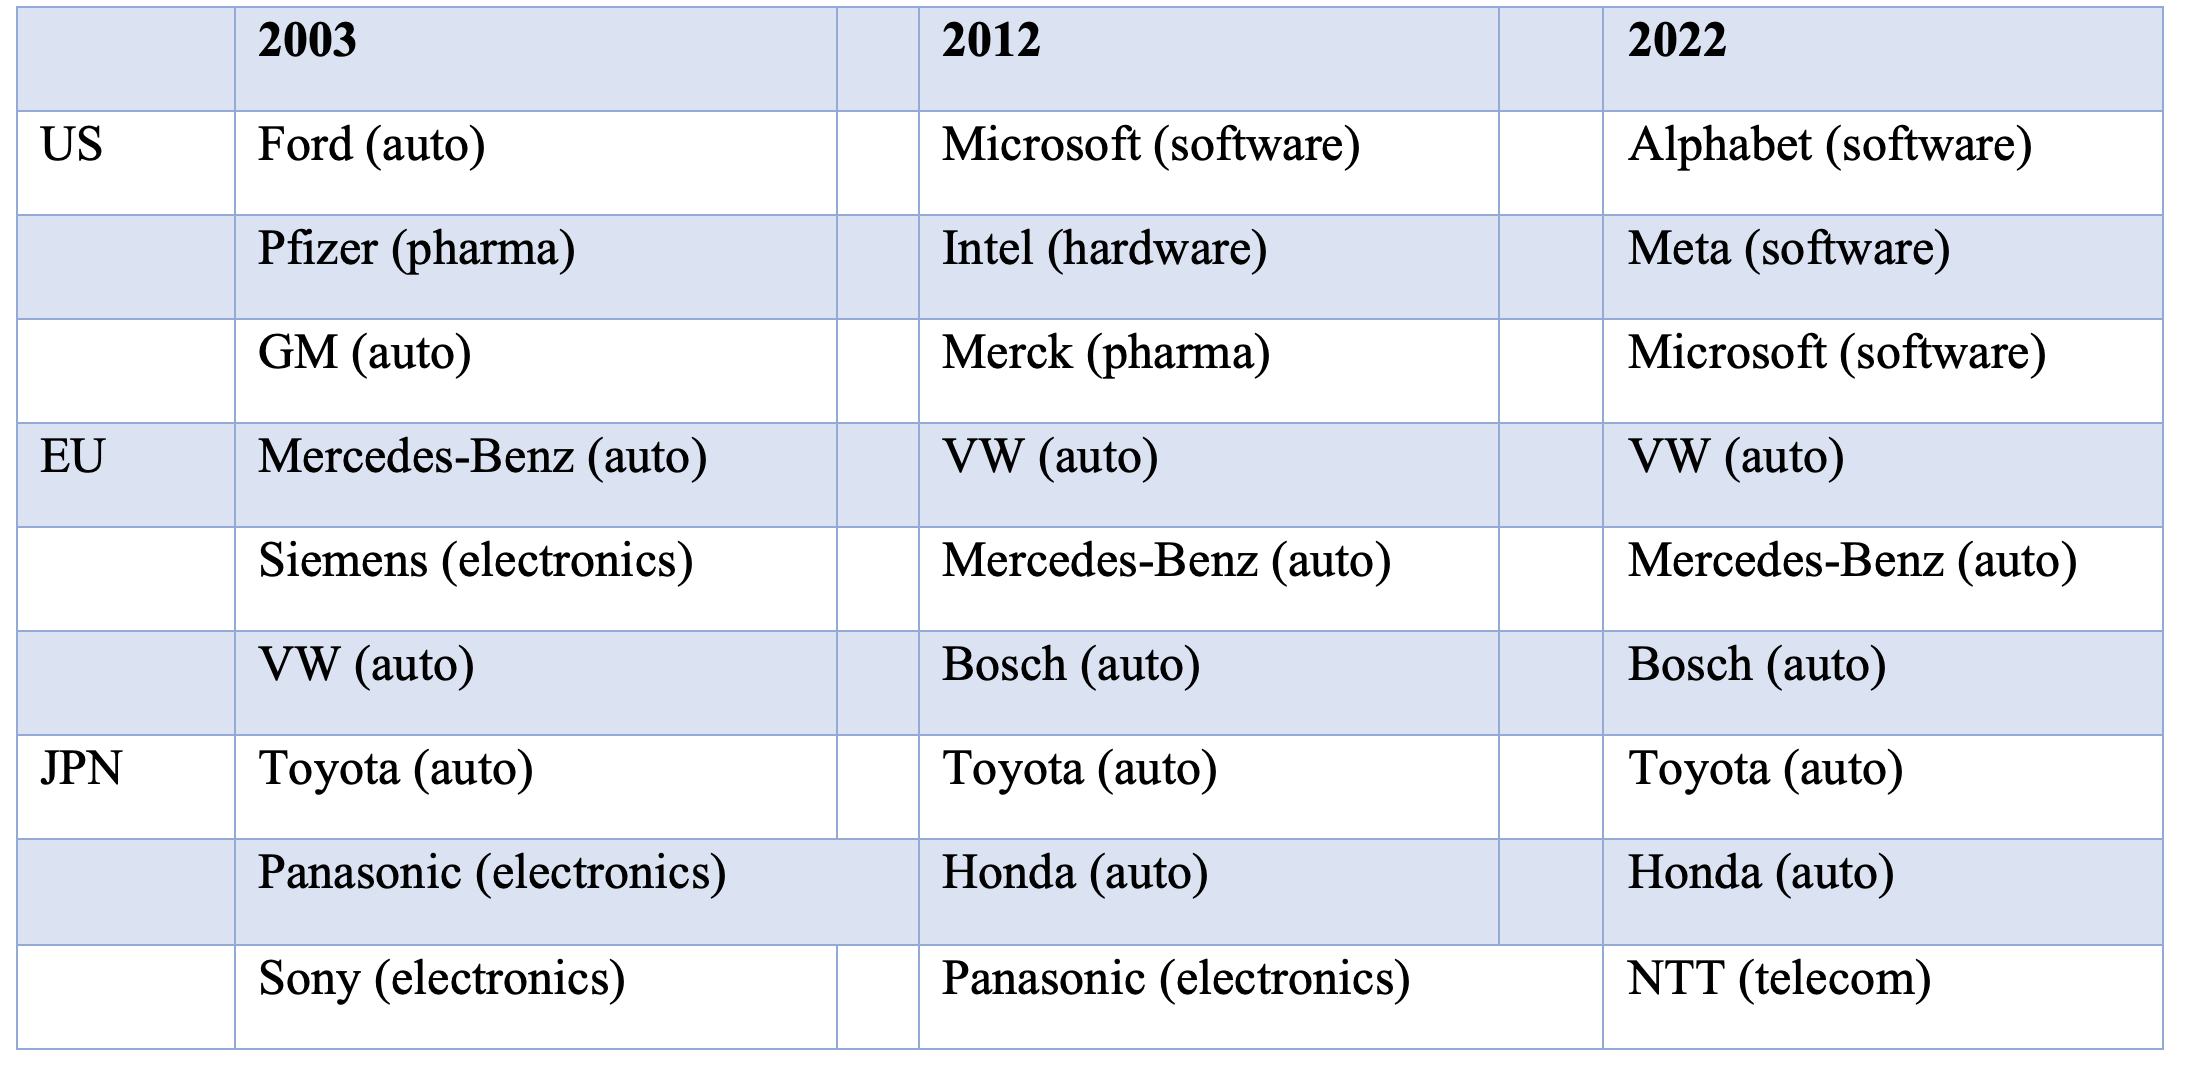
Table 1 shows the top three R&D spenders and their industries over time as a further illustration of the diverging development across the Atlantic. It gives the top three companies in terms of R&D spending and their respective industries over the last 20 years in the US, EU, and Japan.
In the US, Microsoft is the only company appearing more than once among the top three R&D spenders. Meanwhile, in the EU and Japan, Volkswagen (VW), Mercedes, and Toyota remain in the top three over the 20 years, while Panasonic, Bosch, and Honda appear at least twice.
Interestingly, in the US two of the three top R&D spenders in 2003 were also in the automotive industry, but this changed over time. The software industry became increasingly important over the years; by 2022, all top-three spenders produced software. In the EU and Japan, the auto industry tended to dominate throughout the 20-year period. These patterns are consistent with the literature on path dependence in innovation and industrial specialisation (e.g. Acemoglu, 2023, Aghion et al. 2021, Aghion et al. 2016).
Table 1 Top three R&D spenders and their industries compared over time
Source: Industrial R&D Investment Scoreboard (2004, 2013 and 2023).
EU (and Japanese) industry thus failed to transition to high-tech sectors. One reason might that the incentive to do so was much lower in Europe, where the profit margin of high-tech industries was only about 3 percentage points higher than mid-tech ones, whereas in the US the difference in profit margins between high-tech and mid-tech industries was about 7 percentage points (Redding and Melitz 2021). The incentive to allocate capital to high tech firms was thus much higher in the US than in Europe.
It is possible that the higher profit margins of US high-tech firms at least partially reflect the near-monopoly position of US software giants in their respective markets. But this does not alter the fact that the availability of higher profit margins for US firms presented a strong incentive to invest in these industries. R&D-intensive industries can be considered natural oligopolies, in which a few market leaders emerge, sustained by the dynamics of large market shares fuelling R&D, which in turn sustain large market shares in a virtuous cycle leading to dominant positions.
In these industries, sales and R&D expenditures follow a similar pattern (Sutton 2007).
The evolution of profits in our data reflects these patterns of natural oligopoly formation. The initial advantage of the US in high-tech was magnified over time, whereas EU (and Japanese) industries remained in their specialisation pattern. Breaking this path dependency justifies public-sector intervention to provide the seeds for an alternative model of specialisation.
How to break out: Fostering innovation
In the US, the Defense Advanced Research Projects Agency (DARPA) is widely credited as having played a crucial role in fostering the emergence of high tech, including such pivotal innovations as the internet. ARPA, as it was called initially, was created in response to the ‘Sputnik shock’ of the late 1950 to support, as the name suggests, advanced research projects that are not of commercial interest because their significance might reveal itself only later. The selection of the projects to be financed is left to the Agency that employs by now close to 100 highly qualified programme managers. This model of supporting advanced research is not limited to the defence sector, there exist now ARPAs for energy health and artificial intelligence.
The European pendant to DARPA was supposed to be the European Innovation Council (EIC), created in 2021 with the aim of supporting disruptive innovations. The name ‘Council’ is actually misleading since the EIC consists essentially of three separate programmes, called Pathfinder, Transition, and Accelerator. As the headings suggest, Pathfinder finances projects at their early stage, whereas the purpose of Accelerator is to ‘accelerate’ the commercial application of emerging technologies and support the growth of start-ups. The annual budget of the EIC is about €1 billion (against about $4 billion for DARPA alone).
Similar to the ARPAs, the details of EIC calls are set by programme managers within the overarching objectives of the European Commission. Programme managers also determine the specific goals of the individual projects and group them in thematic portfolios.
Still, despite efforts to emulate the salient features of the ARPA model, the EIC falls short in at least two key respects.
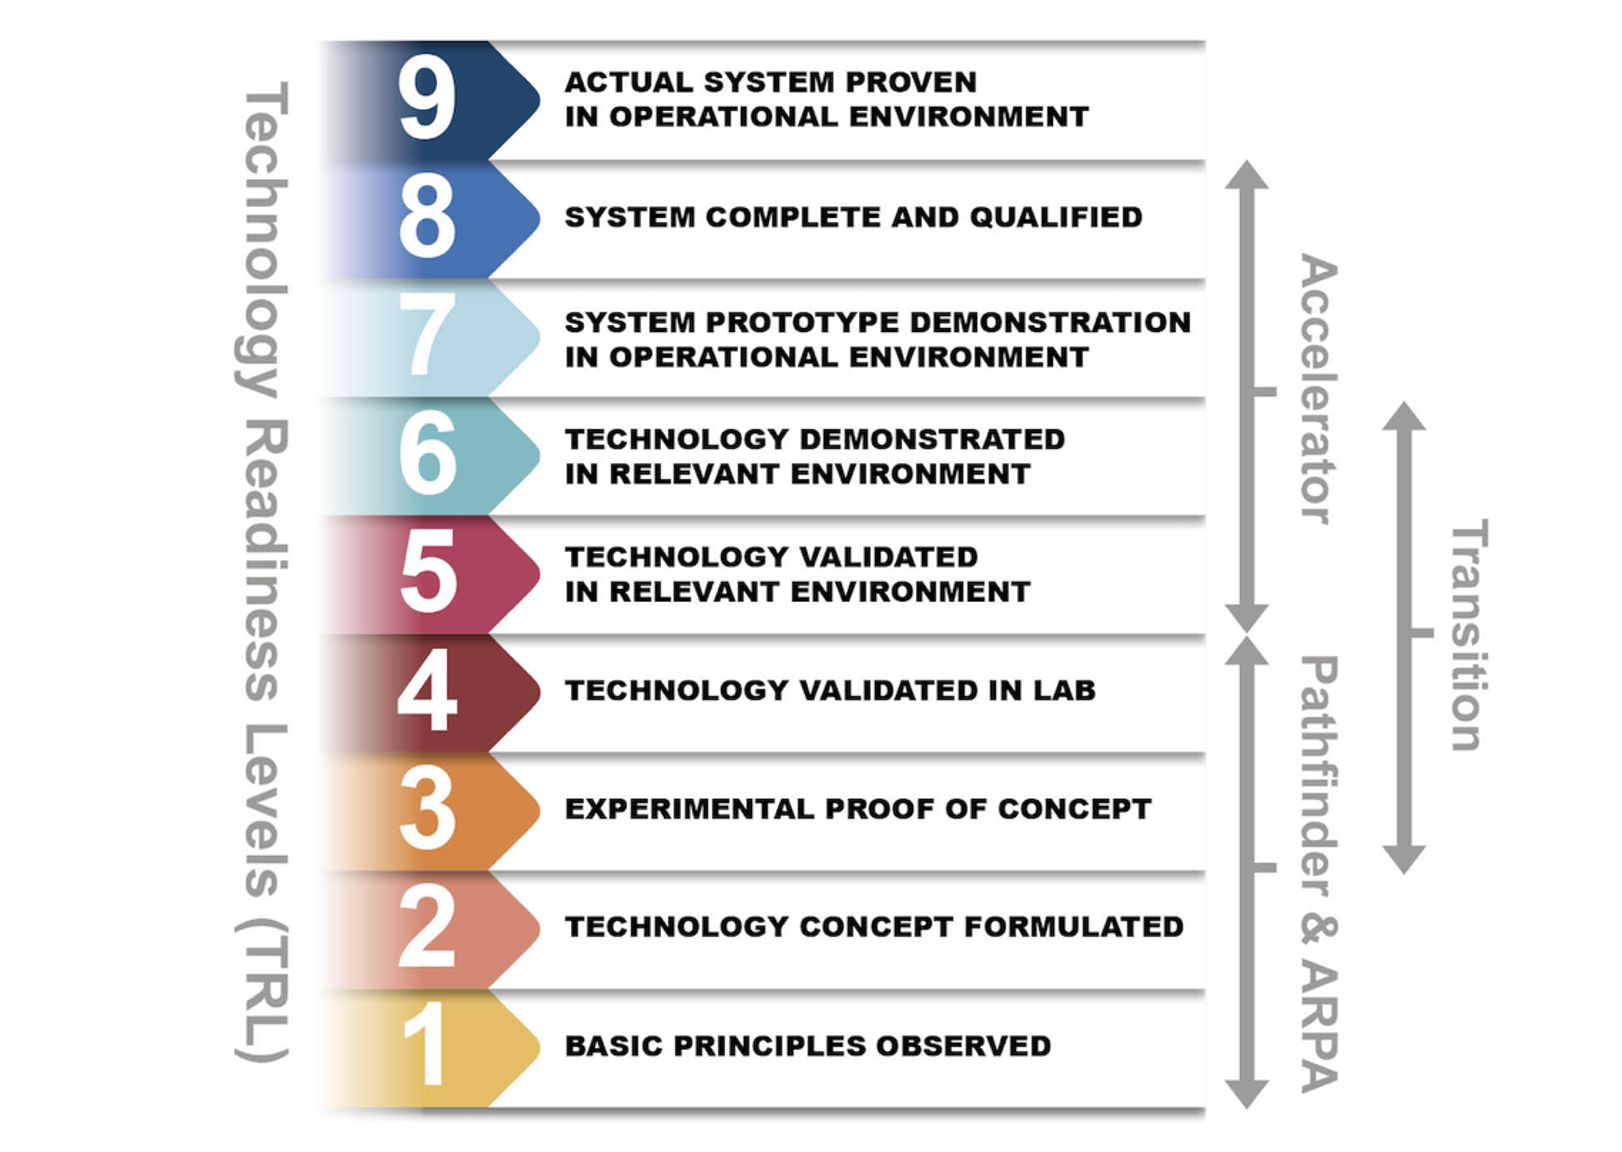
A first key aspect, the type of projects financed by the EIC, can best be explained using a technology readiness level (TRL) indicator, described in Figure 2. This indicator goes from 1 (only basic principles observed) to 9 (actual systems in operation). ARPAs typically focus on developing ‘proof-of-concept’ (Azoulay et al. 2019) or projects up to TRLs 3-4 at most. Once projects reach a sufficient maturity, usually taken to be the demonstration stage (TRL 5 or above), they ‘graduate’ and leave ARPAs with the expectation that private capital will flow and scale them up.
Figure 2
Source: Authors’ representation based on official sources.
Azoulay et al. (2019) position ARPA-funded projects on the initial flat part of the innovation S-curve, relating research effort and technical progress (Foster 1986).
On the initial part of the curve, a high degree of effort results in very limited performance gains, and delayed payoffs limit incentives to pursue the project. This is where public-sector support is most needed because it addresses a clear market failure.
Instead, about two thirds (€700 million) of the annual budget of the EIC goes to the Accelerator progamme that finances projects with TRLs above 5. This is expressed in the official task of the EIC to “support disruptive innovations throughout the lifecycle from early stage research, through to the financing and scale up of start-ups and SMEs”. The EIC thus has a dual mission not only to support disruptive innovation, but also to finance scale-up and SMEs. It is thus not surprising that the management of the EIC programmes is housed in the former EU executive agency for SMEs, renamed the European Innovation Council and SMEs Executive Agency (EISMEA).
Given the large share devoted to high TRL products, the EIC thus has only about €300 million for ARPA type projects, one tenth of DARPA alone.
A second key difference concerns the selection of projects and their management. First, the selection process is still politically controlled, which is in conflict with the best international standards (ARPA structures here, and also NSF, NIH and the EU’s own ERC for fundamental research) Second, the EIC has only a very small number of project managers, each of which oversees dozens of projects. This means that each project manager has to deal with projects that are outside her areas of expertise. Moreover, only about one half of the Board of the EIC is composed of scientists and engineers that might have the qualification to find the most promising projects.
Based on this analysis we propose two approaches to improve EU support for innovation that do not require an increase in the EU budget:
- Better management. Reform the governance of the EIC, hiring a larger number of independent and highly qualified programme managers and giving them greater discretion over project selection and management.
- Better use of budgetary resources toward disruptive research, which currently accounts for a paltry 5% of total funding. Scale down existing under-performing programmes like the European Institute of Innovation and Technology (EIT) and the European Innovation Ecosystem (EIE). Replace the financing of equity stakes from the Accelerator budget with other sources whose mission is investment, rather than innovation. For example, the EIC could be merged with the European Investment Fund (EIF) or the proposed Sovereignty Fund. This would free up €0.41 billion per annum.
With this combination of management reforms and redirection of existing resources, Europe could create a much stronger structure to prioritise and boost game-changing innovations through a budget neutral restructuring, thus taking into account limitations for the overall EU budget.
References
Acemoglu, D (2023), “Distorted innovation: does the market get the direction of technology right?”, AEA Papers and Proceedings 113.
Akcigit, U (2024), “Economic Renaissance: Unleashing Business Dynamism for Economic Growth”.
Aghion, P, J Van Reenen, R Martin, D Hémous and A Dechezleprêtre (2012), “Carbon Taxes, Path Dependency and Directed Technical Change: Evidence from the Auto Industry”, CEPR Discussion Paper 9267.
Azoulay, P, E Fuchs, A P Goldstein and M Kearney (2019), “Funding breakthrough research: Promises and challenges of the ‘ARPA Model’”, Innovation Policy and the Economy 19(1): 69-96.
Biondi, F, S Inferrera, M Mertens and J Miranda (2024), “Declining business dynamism in Europe: The role of shocks, market power, and responsiveness”, VoxEU.org, 21 March
Decker, R A, J C Haltiwanger, R S Jarmin and J Miranda (2020), “Changing business dynamism and productivity: Shocks versus responsiveness”, American Economic Review 110(12): 3952-3990.
Foster, R N (1986), “Working the S-curve: assessing technological threats”, Research Management 29(4): 17-20.
Fuest, C, D Gros, P-L Mengel, G Presidente and J Tirole (2024), “EU Innovation Policy: How to Escape the Middle Technology Trap”, Report by the European Policy Analysis Group, Institute for European Policymaking at Bocconi University.
Marino, M, S Lhuillery, P Parrotta and D Sala (2016), “Additionality or crowding-out? An overall evaluation of public R&D subsidy on private R&D expenditure”, Research Policy 45(9): 1715-1730.
Redding, S and M J Melitz (2021), “Trade and innovation”, VoxEU.org, 28 July.
Szücs, F (2020), “Do research subsidies crowd out private R&D of large firms? Evidence from European Framework Programmes”, Research Policy 49(3): 103923.
Sutton, J (2007), “Market structure: theory and evidence”, Handbook of Industrial Organization 3: 2301-2368.


