Increasing concerns about the dominance of those from more privileged backgrounds in professional settings, high-level positions, and access to quality education have driven some governments, firms, and institutions to analyse the issue and introduce measures aimed at increasing socioeconomic diversity in education and the workplace (e.g. KPMG and Bridge Group 2022, City of London Corporation 2022). Growing income inequality, low social mobility, and limited educational opportunities are all intertwined in explaining the ‘class ceiling’ faced by less privileged applicants in many areas of the labour market. Raising socio-economic diversity in the world of work and education is important not simply because fairness and equality of opportunity are at the heart of democracy, but also because harnessing the talents of the economically disadvantaged can deliver substantial economic benefits in terms of productivity and growth. After summarising evidence on these themes with a focus on the UK and France, and outlining the economic case for widening the talent pool, this column concludes with a summary of some ongoing initiatives together with concrete policy proposals that aim to accelerate the momentum for increased socioeconomic diversity in the workplace and educational opportunities across Europe.
Born smart but less privileged often means being overlooked in professions and top jobs
Inequality of opportunity, unequal education, and barriers faced by those from less privileged backgrounds prevent access to occupations, professions, and top jobs. For those who overcome these barriers, career progression and pay in prestigious jobs is substantially inferior to those from more privileged backgrounds due to ‘invisible obstacles’ such as unconscious bias among job interviewers, unfair work allocation, lack of connections, and exclusion due to ‘not fitting in’. Higher socioeconomic backgrounds dominate careers in top jobs and the professions:
- Britain’s power structures are dominated by the roughly 1% of the population who graduate from just two universities, Oxford and Cambridge. For example, 71% of senior judges are Oxford or Cambridge university educated – Table 1 (Sutton Trust and Social Mobility Commission 2019).
- 89% of senior level employees (senior managers and above) in UK financial services are from a higher socio-economic background (defined by parental occupation), while in terms of career progression, ‘employees from lower socioeconomic backgrounds are found to take 25% longer to progress through grades’ (Bridge Group 2021a).
- In the UK, those from working-class backgrounds who manage to secure prestigious jobs (in the professions, etc.) are paid, on average, 16% less than those from privileged backgrounds (Friedman and Laurison 2019). According to upReach, a student from a disadvantaged background who gains a first class degree from a top university is less likely to secure an elite job than a more privileged student with a 2:2. "Social class is the biggest barrier to career progression, compared to any other diversity characteristic" (KPMG and Bridge Group 2022).
- 62% of executives in French corporations (who are French nationals) have parents who were also executives/professionals,
while only 4% of French executives have parents in ‘manual labour’ occupations (Table 2). In addition, ‘Half the chief executives from companies in the SBF 120, the index of France’s 120 biggest companies, graduated from one of just four elite schools — HEC Paris, Insead, Ena or Polytechnique’ (Bradshaw 2019).
Table 1 The 10 UK professions with highest Oxford and Cambridge University attendance
Notes: Figures based on 2014; ‘Lords’ = members of the House of Lords.
Source: Sutton Trust and Social Mobility Commission (2019).
Table 2 Socio-professional categories of parents of French executives
Notes: Figures are % of survey respondents; ‘other’ includes unemployed and unspecified.
Source: Sancier-Sultan and Zavjalov (2022).
Overlooking the talent of the less privileged is a missed opportunity for all, as it hurts productivity and economic growth
Socioeconomic disadvantage can be a vicious circle of poorer education, limited connections, and fewer job opportunities in the professions resulting in low inter-generational social mobility, while high income inequality is associated with lower social mobility.
Hence, social mobility has probably been constrained by the acceleration in inequality across most advanced Western economies/OECD countries in recent decades.
Obviously, incomes also play a major role in gaining access to education – whether that is being able to afford to pay for a private school or to buy (or rent) a home in an area with a good school – and is a key element behind education inequality and social immobility. Disparities in success across socioeconomic backgrounds have severe negative repercussions for productivity and economic growth, as vast swathes of the population are not reaching their human capital and productivity potentials. Widening the talent pool and increasing social mobility would help to unleash the full productivity of society’s less privileged members and raise economic growth:
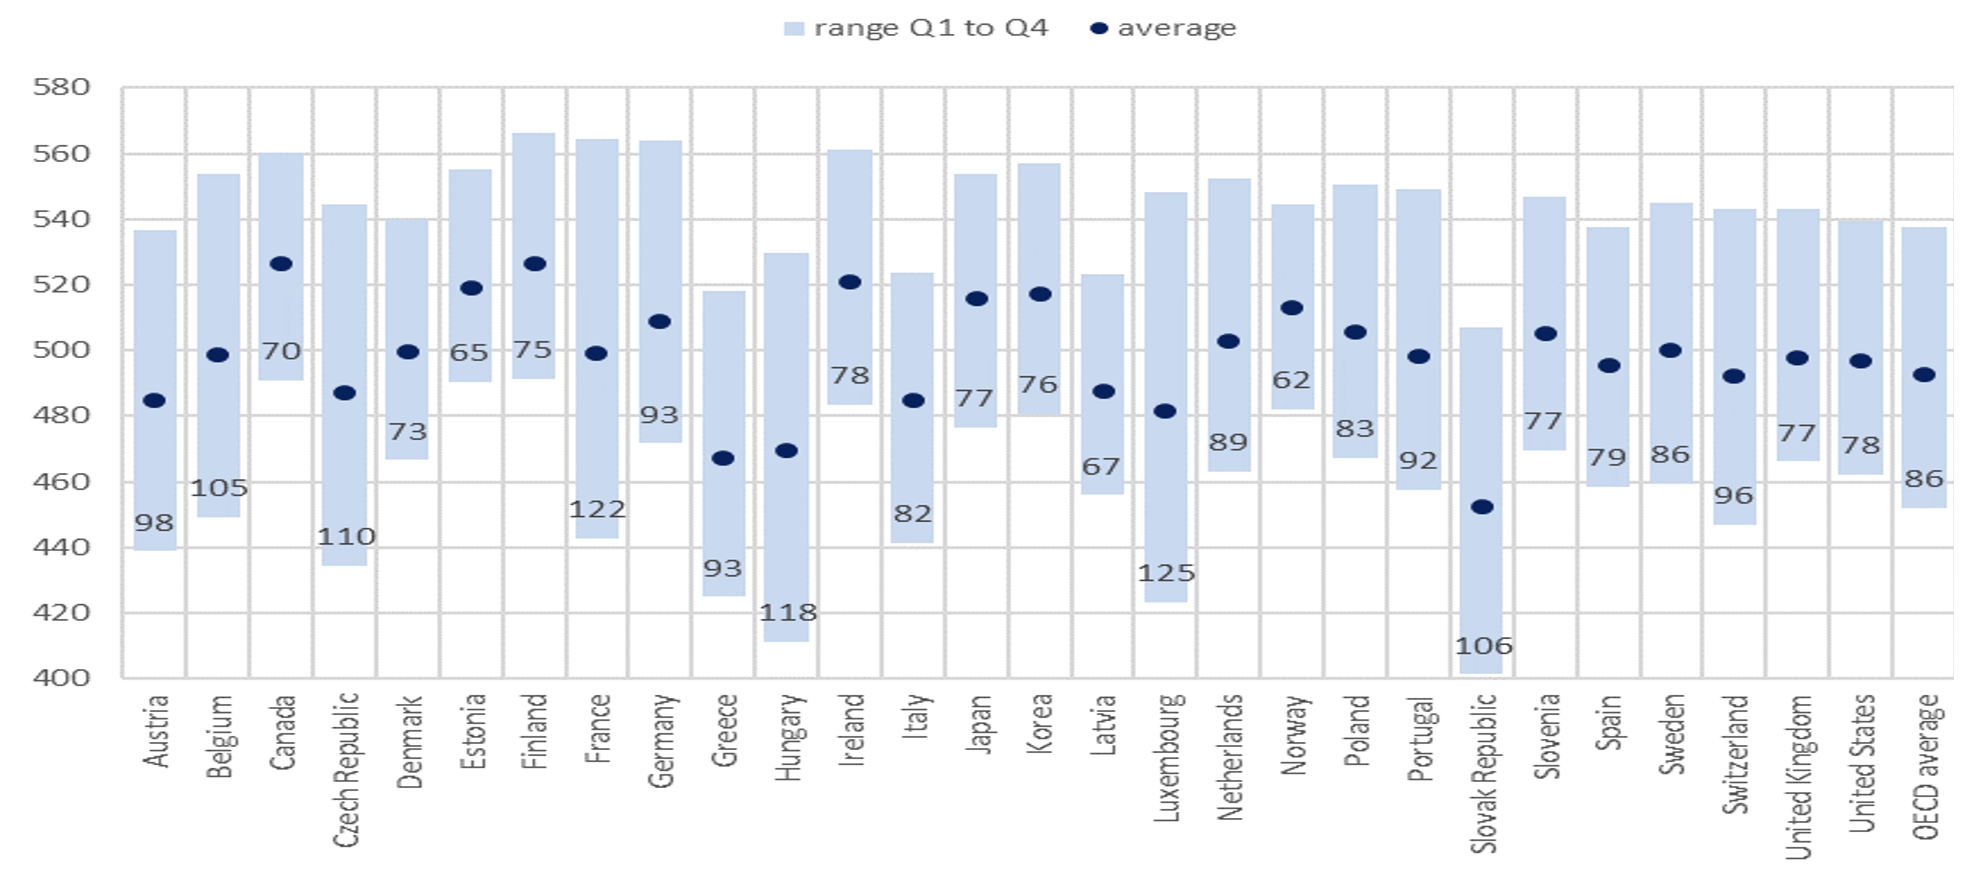
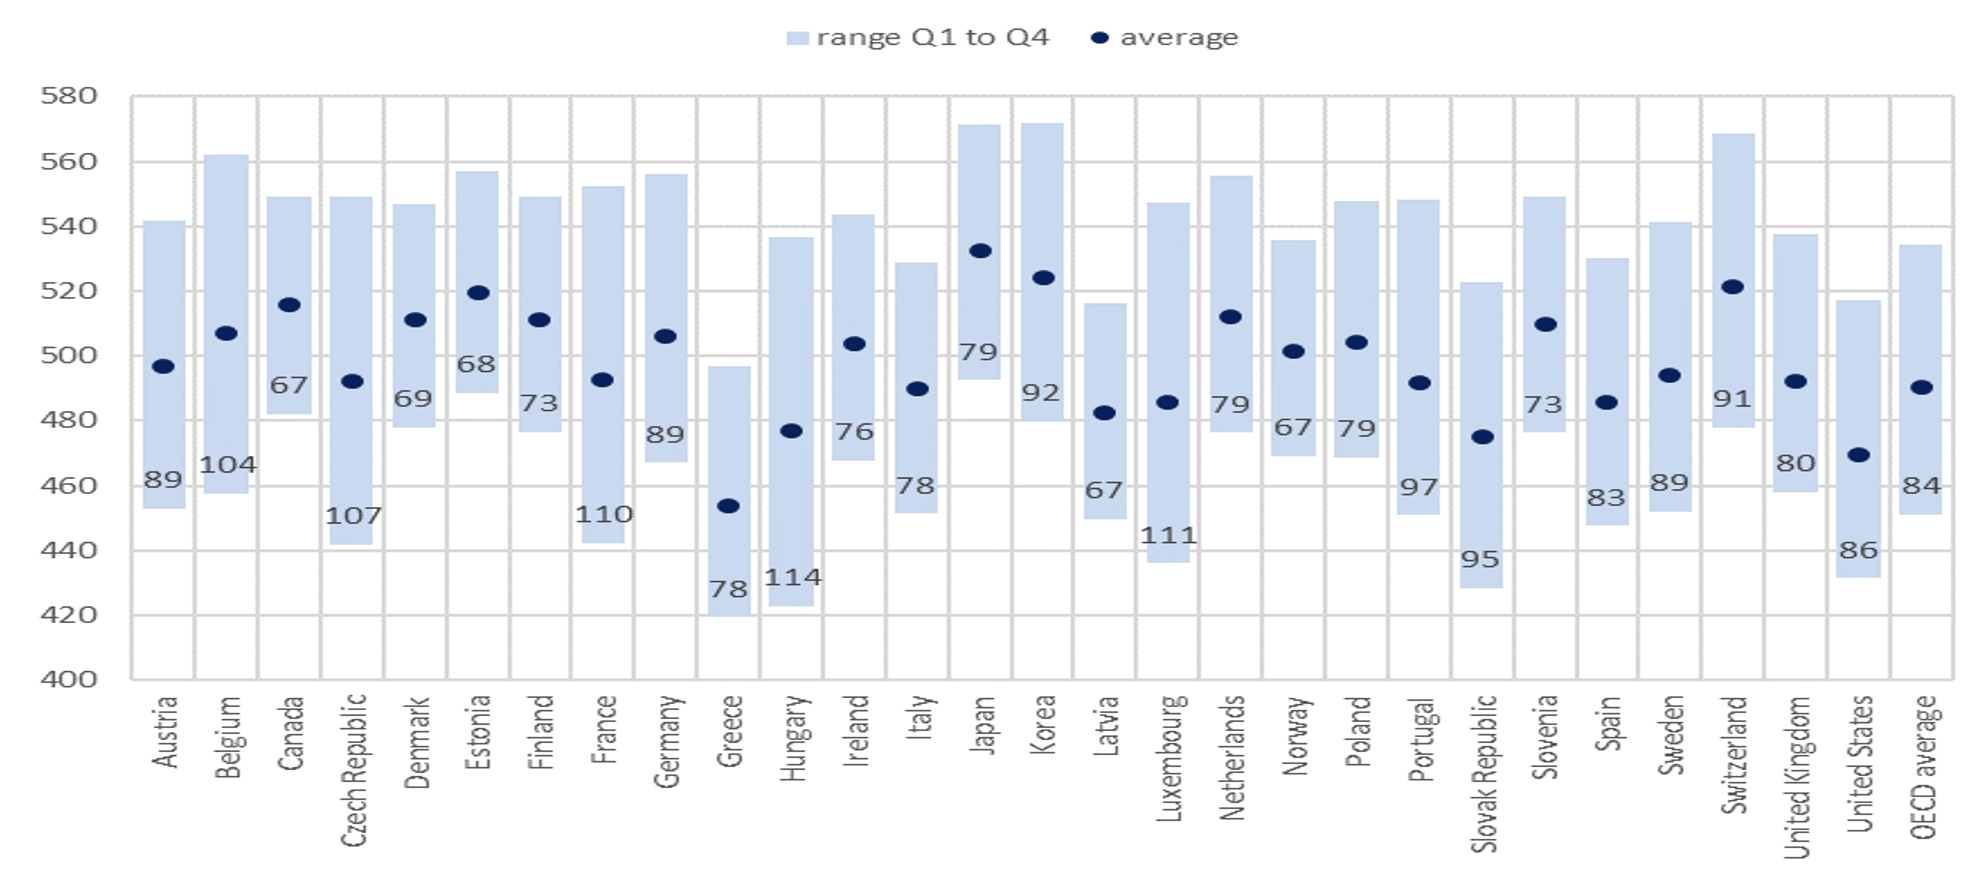
- The enormous inequality in education is revealed by the considerably worse PISA scores for mathematics and reading for children from families in the bottom 25% socioeconomic group compared to the top 25% (Figure 1).
Among OECD countries, France has one of the largest gaps in these PISA scores between the privileged and less privileged.
- Social mobility is low in many countries: in an ‘average OECD country it would take around four to five generations for children from the bottom earnings decile to attain the level of mean earnings’. Some major European countries are less socially mobile than the average (i.e. France and Germany take around six generations; both Italy and the UK take around five generations).
If your father’s earnings are in the bottom (top) quartile, then your earnings are unlikely (more likely) to be in the top quartile. ‘In terms of occupation, about a third of children from manual workers remain manual workers themselves’.
- Widening the talent pool and increasing the diversity of teams in the workplace brings benefits in terms of productivity, creativity, and innovation (Cooper et al. 2023). Even more importantly, the currently overlooked and underdeveloped talents of individuals from less privileged backgrounds, and the missed human capital investment opportunities they represent, means that productivity is below the levels that could be achieved if the talents of the economically disadvantaged could be fully harnessed.
If the UK increased its level of social mobility to the Western European average, this ‘could be associated with an increase in GDP of approximately 9%, equivalent to £2,620 per person, or £170bn in total (in 2016 prices)’ (Oxera 2016). Estimates across OECD countries suggest that reducing inequality can increase annual average GDP growth by almost 0.3 percentage points (Cingano 2014).
Figure 1 Range of children’s PISA scores between the bottom and top socioeconomic groups
a) Reading
b) Mathematics
Notes: The figure reports the mean PISA 2015 results for selected OECD countries (‘average’) and the mean scores of children from families in the bottom (Q1) and top (Q4) quarters of a measure of socioeconomic status – i.e. the PISA index of economic, social, and cultural status (ESCS) – where the lower score for each country is always the bottom (Q1) socioeconomic group. The numbers in the columns refer to the gap between the mean scores in the top and bottom quarters of socioeconomic status for each country.
Source: OECD (2016).
Policies for increasing socioeconomic diversity in education and the workplace
Children and young people from disadvantaged backgrounds can benefit from more support from schools and universities
Universities can work with schools in poorer areas, as well as fine-tuning their admissions policies, to encourage greater representation in higher education of less privileged students.
School admission policies whereby children are selected based on the location of their residence could be changed to allow greater integration of children from different socioeconomic backgrounds so that all can benefit from the knowledge of their peers with different experiences.
Universities with fewer disadvantaged students can implement and/or increase the use of contextualised admissions policies by offering places at reduced grades for less privileged candidates, thereby acknowledging their achievements given their circumstances.
The time is ripe for accelerating socioeconomic diversity initiatives in the workplace across EU countries and Europe broadly, helped by existing templates and toolkits
There are many ongoing initiatives to increase socioeconomic diversity in the workplace which could also be adopted by other European firms and large institutions.
Detailed templates and toolkits outline the various steps for incorporating more socioeconomic diversity in the workplace (see e.g. Bridge Group and Social Mobility Commission 2021b). European employers could offer more work experience placements targeted at school and university students from disadvantaged backgrounds as well as using contextualised qualifications and CVs when recruiting.
Author’s note: The views expressed are those of the author and do not represent those of the University of Nottingham, OFCE, or SciencesPo.
References
Bonneau, C, P Charousset, J Grenet and G Thebault (2021), “Quelle démocratisation des grandes écoles depuis le milieu des années 2000?”, Rapport Institut Politiques Publiques no. 30.
Boone, L and A Goujard (2019), “France, inequality and the social elevator”, OECD blog, 27 February.
Bradshaw, D (2015), “Elite universities hold the key to top corporate jobs”, Financial Times, 29 October.
Bridge Group (2021a), “Who gets ahead and how? Socioeconomic background and career progression in financial services: a study of 8 organisations”.
Bridge Group and Social Mobility Commission (2021b), “Socio-economic diversity and inclusion: Employers’ Toolkit Cross-Industry Edition”.
Cingano, F (2014), “Trends in income inequality and its impact on economic growth”, OECD Working Paper no. 163.
City of London Corporation (2022), “Breaking the Class Barrier: Recommendations for building a more socio-economically diverse financial and professional services sector”.
Cooper, C, A Hamiltion, C Shaw and L York (2023), “Fixing the ladder: how UK businesses benefit from better social mobility”, McKinsey and Company, 25 January.
Dabla-Norris, E. et al. (2015), “Causes and consequences of income inequality: A global perspective“, IMF Staff Discussion Note no. 2015/013.
Dherbécourt, C (2020), “Social mobility in France: what do we really know?”, France Stratégie, 28 September.
Dherbécourt, C (2022), “Equality without mobility: new estimates of intergenerational income mobility in France”, seminar paper presented at Observatoire Français des Conjonctures Économiques (OFCE), Sciences Po, France.
Doepke, M, J Stuhler and J Blanden (2022), “Unequal education and the ‘Great Gatsby Curve’”, VoxEU.org, 20 December.
Friedman, S and D Laurison (2019), The Class Ceiling: why it Pays to be Privileged, Bristol University Press.
KPMG and Bridge Group (2022), Social Mobility Progression Report 2022: Mind the gap, December.
OECD (2016), “PISA 2015 Results: Excellence and Equity in Education Volume 1”.
OECD (2018), “A Broken Social Elevator? How to Promote Social Mobility”.
Oxera (2017), ”Social mobility and economic success: how social mobility boosts the economy’’, prepared for the Sutton Trust, 12 July.
Sancier-Sultan, S and S Zavjalov (2022), “Beyond gender: promoting diversity in French companies”, McKinsey and Company, 15 March.
Sutton Trust and Social Mobility Commission (2019), “Elitist Britain: the educational backgrounds of Britain’s leading people”.
Upreach (2023), Transforming Social Mobility.
Venturi, R (2016), “The economic cost of workplace discrimination in France – billions of euros in lost potential”, France Stratégie, 28 September.
Vona, F (2015), “Intergenerational mobility in four large EU countries: does one model fit all”, OFCE blog, 25 January.


