The financial crisis of 2008 has been partially blamed on excessive leverage among households and financial intermediaries (Sufi and Mian 2010, Admati and Hellwig 2013, Reinhardt and Rogoff 2010). However, much less attention has been paid to the indebtedness of non-financial corporations – the productive engine of the economy.
Non-financial firms are responsible for producing most of the country’s output and employing most of its workers. Consequently, the financial health of this sector is often the focus of government policy. For example, some commentators and members of Congress have recently argued for eliminating the interest tax deduction for corporations, in part to reduce the incentive to use debt financing. To maintain or improve the health of this sector via policy or regulation, one must first have some context and understanding of what drives the financing of these corporations. But there is a knowledge gap here.
New research on non-financial corporations
In our recent work, we attempt to fill the gap by investigating the financial policies of nonfinancial corporations over the last century (Graham et al. 2014a).1 As described in detail below, we uncover evidence that a primary factor affecting the amount of corporate borrowing is the amount of borrowing by the government, perhaps to fund a budget deficit. In particular, we find strong evidence that governmental borrowing ‘crowds out’ the ability of the corporate sector to borrow.
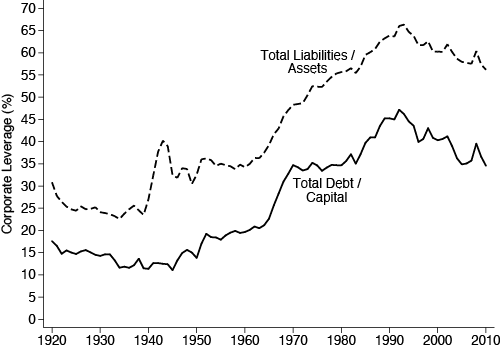
Figure 1 illustrates the significant transition of the corporate sector from equity-based funding to debt-based funding over the last century. The solid line shows that aggregate corporate leverage (i.e. the debt-to-capital ratio) was low and stable from 1920 to 1945, but more than tripled – from 11% to 35% – between 1945 and 1970, before peaking at 47% in 1992. Combined with an increase in non-debt liabilities, the aggregate corporate balance sheet shifted from 25% liabilities in the 1930s to over 65% liabilities by 1990, as revealed by the dashed line in Figure 1.
Figure 1 Annual aggregate leverage ratios
Source: Compustat and Moody's Industrial Manuals.
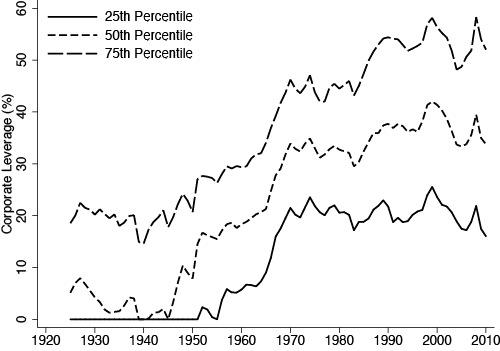
As Figure 2 shows, the dramatic increase in corporate indebtedness was a widespread and broad change in corporate financial policies. The figure shows the evolution of the cross-sectional distribution (25th percentile, median, and 75th percentile) of leverage in which the broad cross-section of firms increased their leverage ratios. In fact, the median firm had no debt in its capital structure in 1946, but by 1970 had a leverage ratio of 31%. Further, the shift was experienced in virtually every industry, further emphasising the systemic nature of the transition.
Figure 2 Leverage distribution (NYSE _rms)
Source: Compustat and Moody's Industrial Manuals.
With this historical perspective, the recent policy debate over debt in the economy, and the corporate sector in particular, seems warranted. For example, there has been discussion of removing the tax deductibility of interest expense for corporations based on the premise that this law incentivises firms to use more debt than they otherwise would. While intuitively appealing, this inference presumes that corporate taxes are the primary cause of the increase in leverage. This is not necessarily so as research has uncovered many reasons for corporate demand for credit (Graham and Leary 2013). More broadly, an informed debate over the appropriate amount of debt in the corporate sector can only occur when the forces responsible for, and implications of these historically high levels of leverage, are understood.
We investigate the forces behind the leverage increase by first asking to what extent this change is accounted for by changing firm characteristics identified in prior studies as capital structure determinants (e.g. Rajan and Zingales 1995, Frank and Goyal, 2009). The answer is not much, if at all. Inspection of individual characteristics reveals that, with the possible exceptions of earnings volatility and firm size, none of the most frequently studied characteristics change over the century in a way that would support greater debt capacity or higher optimal leverage. The composition of firms’ assets – tangible versus intangible – and their growth opportunities did not change in ways that would have predicted the dramatic rise in leverage. Rather, our analysis suggests that an explanation for these trends in financial policy comes from sources of variation not central to the existing capital structure literature.
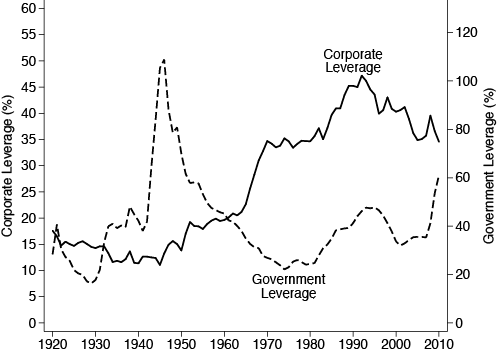
Figure 3 illustrates one of the more promising explanations for the observed variation in capital structure – government borrowing. The figure plots our aggregate corporate leverage series from Figure 1 and overlays the ratio of federal debt held by the public to GDP. A negative relation is fairly clear throughout the first half of our sample. Though the relation appears visually weaker in the second half of the sample, in recent research (Graham et al. 2014b) we show that, in fact, the statistical relation between government and corporate borrowing is stronger after 1970. That study suggests that the strengthening may reflect a combination of increased demand for safe assets by financial intermediaries and increased competition for safe assets from foreign investors, which exacerbated the severity of government borrowing crowding out corporate borrowing.
Figure 3 Corporate leverage and government borrowing
Source: Compustat , Moody's Industrial Manuals and St. Louis Fed.
We also find evidence that maturation of financial institutions and markets is positively correlated with the corporate debt usage. In contrast, the evidence is surprisingly sparse that other common macroeconomic factors affected corporate debt usage. While some of these macroeconomic series appear to be related to corporate leverage on visual inspection, statistical analysis questions the robustness of these relations. For example, corporate taxes underwent 30 revisions over the past century and increased from 10% to 52% between 1920 and 1950. Yet, we find no significant times-series relation between taxes and the choice between debt usage and common equity financing, in large part because of a near decade long delay in the response of leverage to tax changes. Measures of economic uncertainty and aggregate risk, both of which proxy for expected distress costs, are each negatively correlated with leverage, but show no relation in a more rigorous statistical analysis that controls for other leverage determinants. Finally, we find little evidence of a relation between managerial incentives and leverage in the aggregate.
Concluding remarks
We view our analysis as a first step towards understanding the forces responsible for the substantial increase in corporate leverage over the last 100 years. Further analysis is needed to more fully explore the manner in which government debt crowds out corporate debt, as well as the channels by which maturation of financial markets has increased the corporate use of debt. At the same time, the scarcity of evidence that other common economic forces (such as corporate income taxes) have had long-run effects on corporate debt policy suggests that policymakers should be cautious about altering governmental policies in an attempt to reduce corporate debt usage.
References
Admati, Anat and Martin Hellwig (2013), The Bankers New Clothes: What’s Wrong with Banking and What to do about it, Princeton University Press.
Frank, Murray, Goyal Vidhan (2009), “Capital structure decisions: Which factors are reliably important?” Financial Management 38, 1-37.
Graham, John R. and Mark T. Leary (2003), "A review of empirical capital structure research and directions for the future", Annual Review of Financial Economics 3, 309-345.
Graham, John R., Mark T. Leary and Michael R. Roberts (2014a), “As century of capital structure: The leveraging of corporate America”, forthcoming Journal of Financial Economics.
Graham, John R., Mark T. Leary and Michael R. Roberts (2014b), “How does government borrowing affect corporate financing and investment?”, Unpublished working paper. University of Pennsylvania.
Mian, Atif and Amir Sufi (2010), “Household Leverage and the Recession of 2007–09,” IMF Economic Review 58, 74–117.
Rajan, Raghu and Luigi Zingales (1995), “What do we know about capital structure: Some evidence from international data,” Journal of Finance 50, 1421-1460.
Reinhart, Carmen and Ken Rogoff (2010), “Growth in a time of debt,” American Economic Review 100, 573-578.
1 Our emphasis is on what we refer to as the unregulated non-financial sector of the economy, which excludes utilities and railroads. The unregulated firms that we study comprise, on average, more than 75% of all non-financial corporate assets over the last century. Market forces are the primary driver of financing and investment decisions of unregulated entities. In contrast, in regulated entities these forces are significantly tempered by the regulatory environment, which we show leads to extremely stable regulated firm leverage over the last century.


