At a 'Fed Listens' event on 26 September 2019, Richard Clarida, vice chair of the Federal Reserve Board, observed that the flattening of the Phillips curve in recent decades is central to the Fed’s review of policy strategy (Clarida 2019). Price inflation has become much less responsive to resource slack, permitting the Fed to support employment during economic downturns more aggressively than it has in the past.
A flat Phillips curve reduces the chances of a breakout of inflation. This is especially important because the Fed considers the benefits of running a high-pressure economy, and of adopting a policy strategy that makes up for inflation misses to the downside by aiming for subsequent overshoots. Many participants in financial markets go even further than the Fed, believing that the Phillips curve is dead – in other words, excessive inflation is no longer a risk.
Recent experience in the US, Europe, and Japan appears to support this view. Major central banks struggle to get inflation to return to (or even move towards their objectives), even after labour markets have tightened. The US labour market has been running at or beyond estimates of full employment for the past two years, and inflation is still significantly below the Fed’s 2% target.
Indeed, measures of inflation expectations have been drifting lower, not higher as the Phillips curve model would predict. So is this model really dead, or just dormant? If not dead, how can we explain the flattening of the Phillips curve? What might reverse this trend, leading to a resurgence of inflation?
A lot of empirical research has been devoted to these questions over the past decade, for example Yellen (2015), Kiley (2015) Blanchard (2016), Nalewaik (2016), Powell (2018), and Hooper et al. (2019). We know that the Phillips curve was alive and well during the 1950s through the 1970s, and into the 1980s at the national level. Prices and wages showed significant sensitivity to movements in unemployment during this period. These sensitivities increased when the labour market tightened beyond full employment, indicating a nonlinear relationship. Policymakers allowed the labour market to tighten well beyond full employment levels for a sustained period during the 1960s and, at first, inflation remained low and stable. But several years of tight labour markets resulted in the great inflation of the 1970s.
Since the late 1980s, however, there has been only weak evidence of the sensitivity and nonlinearity of the response of inflation to labour market tightening. Efforts to estimate statistically significant price Phillips curve models using national data have generally failed.
Is the Phillips curve dead?
In a recent paper (Hooper et al. 2019), we argue that there are three reasons why the evidence for a dead Phillips curve is weak.
- Anchored expectations. The Fed’s success in limiting inflation to 2% in recent decades has helped to anchor inflation expectations, weakening the sensitivity of inflation to labour market conditions.
- Too little variability in the data. Since the late 1980s there have been very few observations in the macro time-series data for which the unemployment rate is more than 1 percentage point below the natural rate of unemployment, making it difficult to estimate a significant Phillips curve slope or nonlinearities. In other words, the power of tests for the slope of the Phillips curve and nonlinearities would be very low.
- Endogenous monetary policy. The Fed's focus in recent years has been on stabilising inflation and preventing the national labour market from over-tightening. Fitzgerald and Nicolini (2014) and McLeay and Tenreyro (2018) pointed out that the resulting endogeneity of monetary policy can obscure the relationship between unemployment and inflation in macro time-series data. When there is a positive shock to inflation, the Fed tightens monetary policy to keep inflation under control, causing unemployment to rise. Therefore, endogenous monetary policy creates a positive correlation between inflation and the unemployment gap that biases the slope coefficient of the Phillips curve toward zero. This suggests that estimates of the slope of the Phillips since the late 1980s have understated the underlying relationship.
The arguments over variability and endogeneity suggest that we should seek out data that has more variation than the macro time-series data, and is not subject to possible bias from endogenous monetary policy. A natural place to look would be the data for the wage inflation data reported by 50 US states, and the price inflation data reported by 23 major Metropolitan Statistical Areas (MSAs). In these data, there are many more observations of very tight labour markets. Monetary policy is national, and so the same for all states and MSAs. Therefore it can be treated as exogenous in state and MSA data.
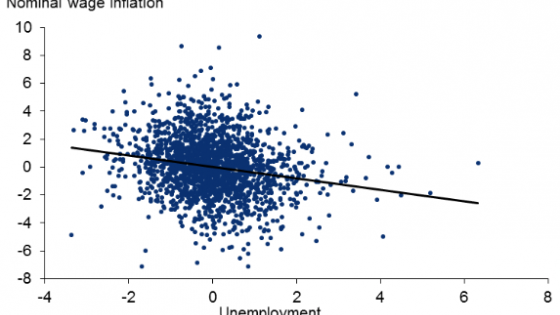
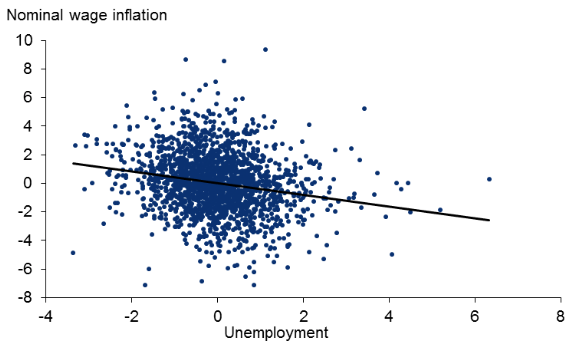
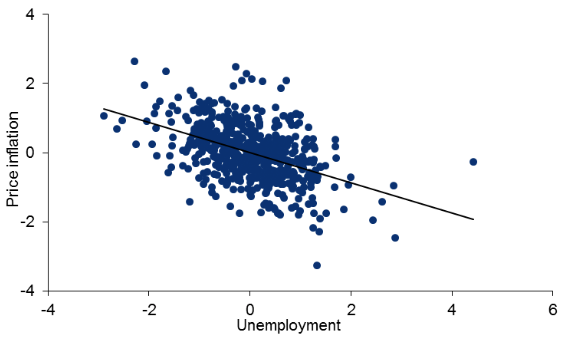
Figures 1 and 2 show that when we estimate wage and price Phillips curves with regional data, we find the Phillips curve alive and well. The regression lines show a steep, significant slope, with significant non-linearities in the responsiveness of wage and price inflation to tight labour markets.
Figure 1 Nominal wage Phillips curve, US states, 1981-2017
Source: Authors’ calculations
Figure 2 Price Phillips curve, US Metropolitan Statistical Areas, 1990-2017
Source: Authors’ calculations
This state and MSA evidence, with the arguments for why the macro time-series evidence on the demise of the Phillips curve cannot be trusted, suggests that the Phillips curve is very much alive, but hibernating.
Could the Phillips curve wake up, and why?
This has happened before. In the mid-1960s, inflation had been low and stable for many years, leading to low and stable inflation expectations. It wasn't until unemployment moved more than a percentage point below estimated levels of the natural rate of unemployment during 1965 that inflation began to increase. Between 1965 and 1966 inflation jumped from 1.5% to more than 3%. A couple of years later, it had doubled again. Based in part on this, Stock and Watson (2009) concluded that inflation does not begin to respond significantly to labour market tightness until unemployment falls 1 percentage point or more below the natural rate.
History could repeat itself. The Fed’s current mission is to do what it takes to keep the economic expansion going, and if the labour market continues to tighten past recent estimates of the natural rate, so be it. As Clarida noted in his speech, the Fed is seriously considering a make-up strategy for monetary policy: allowing or inducing an overshoot of the 2% inflation target if inflation is consistently below this level. To get inflation above target, the Fed may have to allow the labour market to tighten further, possibly as far as Stock and Watson’s 1 percentage-point rule. One of the themes emerging from the Fed’s review of policy strategy this year concerns the broader benefits (not just inflation overshoot) of running a high-pressure economy or overheated labour market.
This potential shift in strategy is accommodated in part by an implicit belief that the Phillips curve is dormant enough that it we don't have to worry about it any time soon. As we have pointed out in Hooper et al. (2019), these beliefs are eerily reminiscent of the way policymakers viewed inflation in the mid-1960s. If inflation does take off, as we learned during the 1970s, the relative flatness of the Phillips curve in loose labour markets means the Fed would have to work extremely hard to bring it back under control – a point that Clarida also made in his September speech.
References
Blanchard, O (2016), "The US Phillips Curve: Back to the 60s?", Policy brief PB16-1, Peterson Institute for International Economics.
Clarida, R H (2019), "The Federal Reserve’s Review of Its Monetary Policy Strategy, Tools, and Communication Practices", speech at "A Hot Economy: Sustainability and Trade-Offs", San Francisco Federal Reserve conference, 26 September.
Fitzgerald, T J, and J P Nicolini (2014), "Is there a Stable Relationship Between Unemployment and Future Inflation? Evidence from US Cities", Federal Reserve Bank of Minneapolis Research Department working paper 713.
Hooper, P, F S Mishkin, and A Sufi (2019), "Prospects for Inflation in a High Pressure Economy: Is the Phillips Curve Dead or is It Just Hibernating?", paper presented at US Monetary Policy Forum, New York.
Kiley, M T (2015), "Low Inflation in the United States: A Summary of Recent Research", FEDS Notes, Board of Governors of the Federal Reserve System.
McLeay, M and S Tenroyo (2018), "Optimal Inflation and the Identification of the Phillips Curve", manuscript.
Nalewaik, J (2016), "Non-Linear Phillips Curves with Inflation Regime-Switching", Finance and Economics discussion series 2016-078, Board of Governors of the Federal Reserve System.
Powell, J (2018), "Monetary Policy and Risk Management at a Time of Low Inflation and Low Unemployment", speech at "Revolution or Evolution? Reexamining Economic Paradigms", 60th Annual Meeting of the National Association for Business Economics, Boston, 2 October.
Stock, J, and M Watson (2009), "Phillips Curve Inflation Forecasts", in Understanding Inflation and the Implications for Monetary Policy: A Phillips Curve Retrospective, Proceedings of the Federal Reserve Bank of Boston’s 2008 economic conference, MIT Press.
Yellen, J L (2015), "Inflation Dynamics and Monetary Policy", speech at the Philip Gamble Memorial Lecture, University of Massachusetts Amherst, 24 September.


