Scholars studying innovation generally consider patents an imperfect indicator of research efforts. Mansfield (1986) and Griliches (1990), amongst others, underlined that not all inventions are patentable – and not all patentable inventions are patented. In addition, a patentable invention can be protected with one, several, or a large set of overlapping patents, and this “propensity to patent” greatly differs across industries and types of firms. Moreover, patenting is shifting from the traditional use of protecting one’s own innovations to new strategic uses (Guellec et al., 2007), further complicating interpretation of patent measures. These complexities cast doubt on the relevance of patent-based indicators for the measurement of innovation performance. Yet they are commonly used by international organisations to rank countries’ relative innovation performance.1
In fact, two components characterise the relationship between patents and research and development (R&D): a “productivity” effect (the number of inventions generated by each researcher) and a “propensity” effect (the extent to which an invention is protected with one or several patents). In a recent paper (de Rassenfosse and van Pottelsberghe, 2008), we present empirical evidence suggesting that patent-based indicators also measure the productivity of research, if one accurately measures patenting activity and accounts for the role of several policy tools.2 The next section presents a new patent count methodology based on priority filings.
Measuring a country’s innovative efforts with patents
There is no perfect way to assess innovation efforts. Although frequently criticised, the most common indicators are the level of R&D expenses and the number of patents. R&D expenses represent an input in the innovation process, whereas patent counts measure one particular type of output. R&D efforts have a well-accepted measurement method, and the OECD provides harmonised yearly series.3 By contrast, there exists no standard methodology for patent data (see e.g., Dernis et al., 2001). It is possible to compute a large number of patent-based indicators, each carrying its own meaning.
Most studies generally rely on patent filings either at the European Patent Office (EPO) or at the US Patent and Trademark Office (USPTO), but this practice induces a strong “home-bias”. USPTO filings include domestic priority filings from US firms and filings from abroad. Needless to say, many more applications can be expected from US firms than from European firms. The reverse is true with the EPO, where European firms have a much higher propensity to file a patent application than US firms. In addition, EPO filings are generally second filings; they do not account for the original priority filings that are made beforehand (Guellec and van Pottelsberghe, 2007).
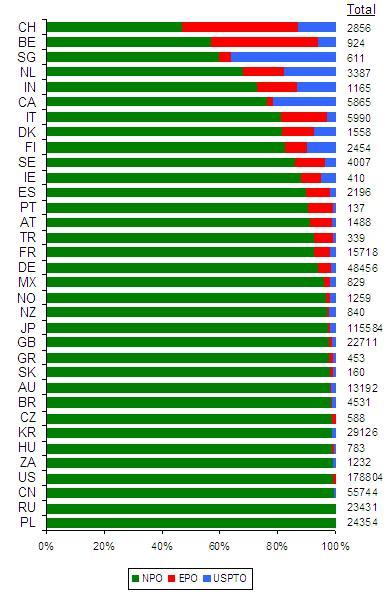
An alternative approach is to rely on the number of priority filings made by the residents of a country. To the best of our knowledge, this counting methodology has been rarely adopted. It is not straightforward to implement, as firms may choose several routes to file their priority applications. It is particularly true in Europe, where the EPO co-exists with national patent offices, and where firms sometimes first file an application at the USPTO and then transfer it to the EPO. A “correct” (or less biased) methodology would therefore consist in counting the number of priority patents filed at different national or regional patent offices. In the case of the Netherlands, for example, 2,298 priority filings were filed before the national patent office in 2003 (EPO’s PATSTAT database, April 2007). During the same year Dutch applicants filed 495 priority filings at the EPO, and 594 priority applications at the USPTO. In other words, a total of 3,387 filings were made by firms based in The Netherlands, a net increase of more than 1,000 patents.
Neglecting EPO or USPTO filings may result in large biases, as Figure 1 points out, especially for Belgium, Canada, India, the Netherlands, Singapore, and Switzerland. The corrected count is reported on the right-hand side of the figure. As compared with the methodology that consists in counting only USPTO or EPO filings, this alternative counting methodology has the advantage of being less subject to the “home” bias, because it accounts for three routes for priority filings (national, EPO and USPTO). An alternative methodology to correct the home bias would count triadic patents, i.e. patents that have been filed simultaneously at the USPTO, the EPO and the JPO. This indicator, developed by the OECD, essentially tracks patents with a very high potential value.
Figure 1. Priority patent filings, 2003
Source: adapted from de Rassenfosse and van Pottelsberghe (2008). In Figures 1 and 2, Japanese priority filings have been divided by 3, as Japanese patents are composed of fewer claims on average, about 8 in 2003, as opposed to 24 in the patents filed at the USPTO. A similar approach has been adopted for South Korean patents. See source for details.
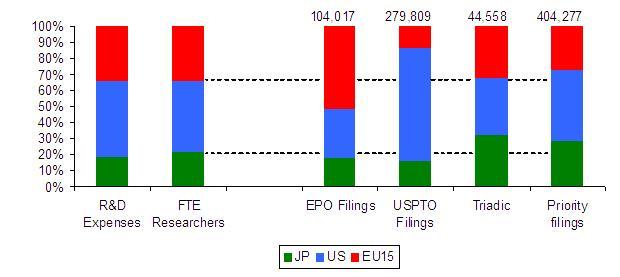
Figure 2 shows the results of various patent counting methodologies (on the right-hand side) compared to two well-known indicators of R&D efforts (on the left-hand side): gross expenditures on R&D expenses and the number of full-time equivalent researchers. The home bias clearly appears for patent counts based on EPO or USPTO data. Filings by European (US) applicants are much more important in EPO (USPTO) data than what the number of researchers or the level of R&D expenses would predict. Triadic patents and priority filings are more in line with the two indicators of R&D activities, with Japan being overrepresented in both cases. In other words, patent counts based on the “corrected” number of priority filings or on the number of triadic patents seem to provide a more accurate measure of relative research efforts. It is worth noticing that the total number of priority filings generated in Europe, Japan and the USA is around 400,000, whereas the total number of triadic patents is around 44,000, suggesting that about one patent out of nine is associated with a high value that justifies a global protection strategy.
Figure 2. Research efforts and patenting activity
Sources: cf. de Rassenfosse and van Pottelsberghe (2008); OECD MSTI, USPTO 2003 annual report, EPO 2003 annual report, own computation.
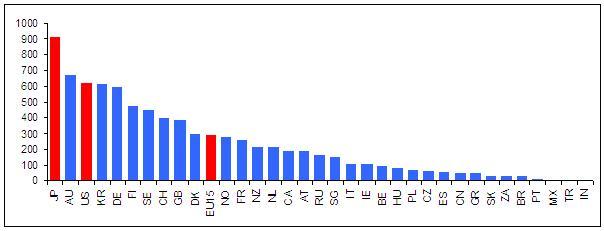
Figure 3 shows the corrected count of priority filings per million inhabitants. Germany is the only European country to perform as well as the US, while the EU15 clearly lags behind. What explains these differences in performance?
Figure 3. Corrected priority filings per million inhabitants
Source: adapted from de Rassenfosse and van Pottelsberghe (2008)
The ‘R&D-patent’ relationship...
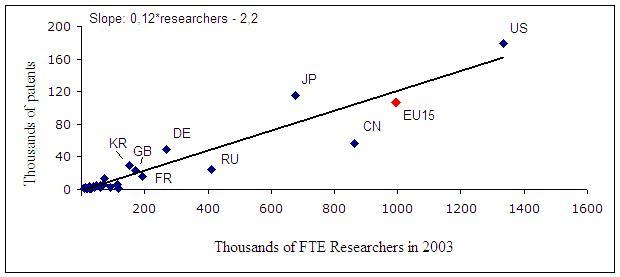
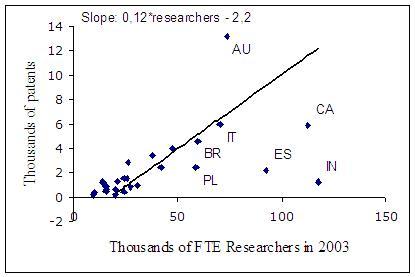
A first glimpse into the R&D-patent relationship is provided by Figures 4 and 5, which plot the number of full time equivalent researchers against the corrected counts of priority filings. There is a clear positive relationship between the number of researchers and patent submissions, but there is substantial heterogeneity. Countries like the US, Japan, Germany, South Korea, Great Britain and Australia are markedly “above” the line. In other words, firms in these countries patent more than what their number of researchers would predict. The EU15 is slightly under the line, as are France, Spain, Canada, Russia, India or China. These differences may be due either to varying propensities to patent or to varying productivity levels of research activities.
Figure 4. Researchers and priority patent filings, 2003
Source: adapted from de Rassenfosse and van Pottelsberghe (2008)
Figure 5. Researchers and priority patent filings, smaller research economies, 2003
Source: adapted from de Rassenfosse and van Pottelsberghe (2008)
We have analysed the extent to which countries apply for more or fewer patents than their number of researchers would predict and argue that the relationship between research efforts (measured by the number of full time equivalent researchers) and the number of priority filings depends on both a research productivity effect and a propensity effect.
In order to test the role of these effects, we perform a cross-sectional econometric analysis of 34 countries, representing more than 95% of worldwide priority filings. The results suggest that the two effects, driven by several policy tools, explain the observed heterogeneity in the number of patents per researcher.
... depends on a research productivity effect…
The design of education policies and science and technology (S&T) policies influences the R&D-patent relationship through a ‘productivity’ effect.
- The higher the human capital index is (or the more educated a country is), the more productive its research efforts are. In other words, countries with a more educated population have more priority filings per researcher. In this respect, Finland, Sweden and Austria score the highest, whereas India, China and Turkey score the lowest.4
- The number of scientific publications per researcher, an indicator of research quality, also has a positive impact on the observed number of patents. Switzerland, Italy and the Netherlands have the highest performances, while China, Russia, and Japan lag behind.
- Gross expenditures on R&D per researcher are an additional determinant of the productivity of research. It seems that better equipped – or better-paid – researchers are more productive in terms of patent filings. Italian, Dutch and Swiss researchers have the highest relative expenditures, contrasting with Russian, Polish and Slovakian researchers.
These three results suggest that patent indicators partly reflect the productivity of research efforts. The design of several policies has a substantial influence on research productivity and therefore affects the R&D-patent relationship.
… and a propensity effect
Patent-based indicators also reflect varying propensity to patent across countries. In particular, intellectual property policies play an important role in fostering the demand for patents.
- Patenting fees are a significant determinant of the demand for patents: a reduction of about 10% in patenting fees would result in an increase in patent filings of 3 to 5%. See de Rassenfosse and van Pottelsberghe (2007) for an in-depth discussion on the role of fees on patenting behaviour.
- Stronger patent rights, such as better enforcement mechanisms, a lower number of restrictions or more patentable subject matters stimulate inventors to file more patent applications.
- A country’s industrial structure also matters. For the same level of aggregate R&D intensity, specialisation in the computer or the instrument industry leads to proportionally more patent filings.
These factors are also pitfalls that make patent-based indicators an imperfect measure of research productivity: two countries with similarly productive research efforts but varying intellectual property policies or technological specialisation may exhibit important differences in patenting performances. Nevertheless, patent data also reflect the productivity of research efforts, as demonstrated by the impact of education and S&T policies on the R&D-patent relationship.
References
G. de Rassenfosse, B. van Pottelsberghe de la Potterie, 2007: Per un pugno di dollari: a first look at the price elasticity of patents, Oxford Review of Economic Policy, 23(4), 588-604.
G. de Rassenfosse, B. van Pottelsberghe de la Potterie, 2008: A Policy Insight into the R&D-Patent Relationship, CEPR Discussion Paper 6716.
H. Dernis, D. Guellec, B. van Pottelsberghe de la Potterie, 2001: Using patent counts for cross-country comparisons of technology output, STI Review, 27, OECD, 129-146.
Z. Griliches, 1990: Patent Statistics as Economic Indicators: A Survey, Journal of Economic Literature, 28(4), 1661-1707.
D. Guellec, B. van Pottelsberghe de la Potterie: The economics of the European patent system, Oxford University Press, Oxford 2007, 250 pp.
D. Guellec, B. van Pottelsberghe de la Potterie, N. van Zeebroeck, 2007: Patent as a market instrument, in: D. Guellec and B. van Pottelsberghe de la Potterie, The economics of the European patent system, Oxford University Press, Oxford, Chapter 4, 85-113.
E. Mansfield, 1986: Patents and Innovation: An Empirical Study, Management Science, 32(3), 173-181.
Footnotes
1 Examples include the IMD World Competitiveness Yearbook (2006); Eurostat, Science, technology and innovation in Europe; or the Economist Intelligence Unit.
2 This note is based on a Bruegel Policy Contribution authored by Gaetan de Rassenfosse and B. van Pottelsberghe in May 2008.
3 See the Frascati Manual published by the OECD for technical information on R&D, and the Main Science and Technology Indicators as well as the ANBERD database for yearly series.
4 Please refer to de Rassenfosse and van Pottelsberghe (2008) for the complete dataset.
