How much will people work in the future? The rise of automation and, more generally, IT-driven structural change in the labour market have made policymakers and researchers worry about ‘disappearing jobs’ and a dire future for employment.1 In this column, we argue that to the extent productivity improvements continue, hours worked in the marketplace will indeed likely fall. However, the argument is not that jobs will disappear.
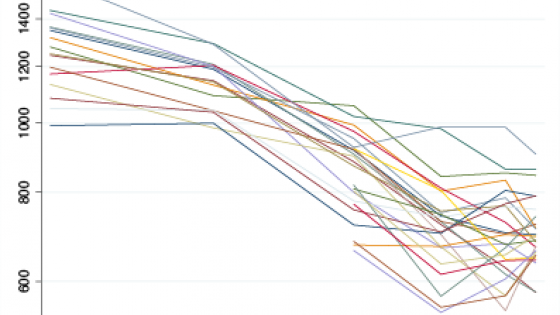
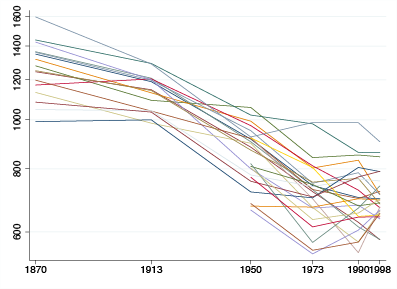
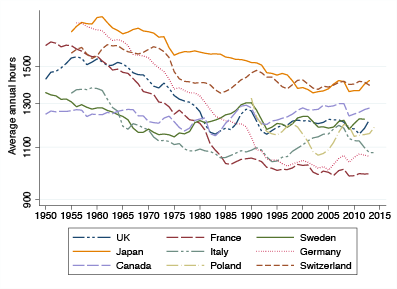
Let us first look at some past data. Figure 1 shows the development of hours worked per capita in the marketplace from a historical perspective for a number of countries.
Figure 1. Average annual market hours worked per capita in 25 countries
Note: the y axis is logarithmic: thus, a straight line reveals a constant rate of change over time. Source: Maddison (2001).
Very clearly, hours worked have been falling consistently, though at a modest rate of a little less than 0.5% per year. What explains this development? Is the pattern representing a gradual disappearance of jobs since the early 19th century, perhaps as a result of technological change? No. The reason, we argue, is rather that technological change has raised labour productivity. People have then acted on this opportunity – they have chosen to work less hard as a result of technological change. Structural change makes some jobs disappear, but new ones emerge. Working hours are an outcome of not just demand but also of supply. Therefore, they will, in particular, reflect the preferences of our economic man (and woman!). By the same token, if we are lucky enough to see productivity continue improving in the future, further decreases in market work are not only expected, but they are also a good thing!
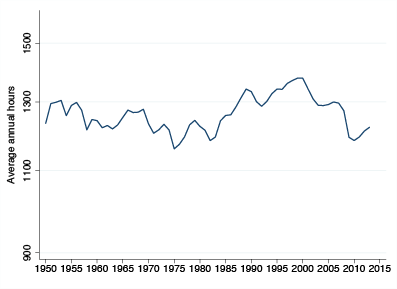
Our approach to this issue is probably in line with the one most macroeconomists would use. It is, however, different in one fundamental respect – a consensus of sorts has emerged over the last 30 or so years, namely, that hours worked are expected to be stationary in the long run and thus not respond to productivity. This consensus has its roots in post-war US data. Figure 2, which shows total hours worked divided by working age population, illustrates this point.
Figure 2. Annual hours worked per working age population in the US
Note: Methodology and source comparable to Rogerson (2006).
These data show that hours worked in the US have gone through visible ups and downs, but without any overall trend, over more than half a century. It is not that macroeconomists are unaware of history — for example, in their arguments for stable hours, Cooley and Prescott (1995) do point out the contrast against the past. In most undergraduate textbooks, moreover, the history is alluded to, sometimes citing a famous passage by Keynes in which he notes that hours have fallen and speculates that his grandchildren will choose to work only 15 hours a week because they will be so much more productive. Keynes was, of course, far off quantitatively, but right qualitatively (on this issue…). Somehow, however, the view that we have now moved into a stationary era has come to dominate, and the workhorse macroeconomic models are all designed to reproduce the long-run constancy of hours. So is this perhaps the right approach?
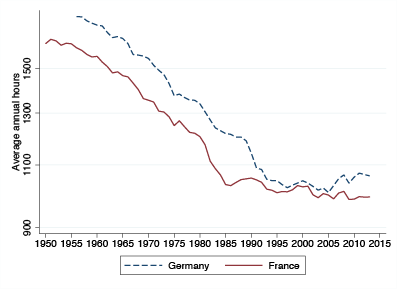
In recent work, we argue the opposite – the post-war US data are, we think, an exception viewed not only from a historical perspective but also from an international one (Boppart and Krusell 2016). They should not, therefore, be taken as representative and guide our theories. They should not, moreover, be used as a basis for building theories of labour supply, from which predictions for the future or policy advice are then obtained. Figure 3a illustrates data from France and Germany and Figure 3b looks at a set of OECD economies, both covering the post-war period.
Figure 3a. Hours worked in France and Germany
Figure 3b. Hours worked in selected OECD countries
These data paint a very different picture. In France and Germany, hours fall at a high average annual rate of about 1%. In a broader cross-section, hours fall over time at an average rate of about 0.45% per year, and this rate is consistent with the longer-run perspective in Figure 1. A rate of 0.5% does not imply very visible changes from year to year but over longer periods of time the fall becomes highly noticeable.
So what explains the data? Over the post-war period, labour productivity has gone up almost by a factor four, as have consumption and output. Productivity improvements do appear to be a key driver, as we also see a significant negative correlation between hours worked and productivity between countries, thus revealing the same pattern in the cross-section as over time. But how come people do not take the opportunity to work more, as their wages grow? We already indicated the answer above. When wages go up, standard microeconomic theory teaches us that there is a substitution effect, making hours worked more attractive than before, relative to leisure. However, there is also an income effect. The income effect makes us richer if we keep hours worked unchanged, and the increased riches are therefore a factor in favour of ‘consuming more leisure’; that is, working less. The standard macroeconomic approach has been to conclude that households must have preferences such that income and substitution effects exactly cancel – how else can stable hours be explained, while productivity, output, and consumption grow steadily and at a significant rate?[2] In contrast, we simply argue that, based on the broader data, the income effect must actually dominate. We show, in particular, that with an income effect that is slightly stronger than the substitution effect, in a stable way regardless of how rich a given society is, then all the data fall neatly into place.
Our interpretation means, first of all, that we have no reason to predict departures from past data in what is to come – if productivity will keep growing in line with its historical patterns, then people will keep working less and less. In 50 years, this will roughly imply a 33-hour workweek (from a current one of 40, say). Of course, if productivity is stagnant, there is no reason to expect a fall in hours, but whether there will be secular stagnation in productivity or the opposite is not a question we wish to speculate on here.
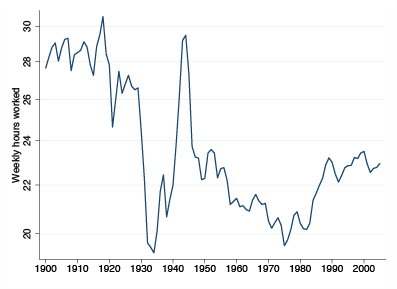
Second, we believe that there are plausible factors that are particular to the US and that can, at least qualitatively, explain its exceptionally stationary hours worked since 1950. First, hours kept falling as before until around 1980, as show in Figure 4.
Figure 4. Weekly hours worked in the US, 1990-2005
Source: Ramey and Francis (2009)
With the Reagan administration, significant tax/transfer cuts were implemented – and later not repealed – and it is mostly the post-1980 years that correspond to a rebound of hours worked. Second, the latter part of the post-war years have seen an increasing rate of female labour-force participation, a phenomenon that has now slowed down. Third, wage inequality widened rather drastically since the late 1970s, and in fact most workers have seen stagnant wages, thus not providing any impetus to work less. Finally, there has been demographic change due to the baby boom adding workers in prime ‘working ages’ over the latter part of the period. We think that all in all, these factors likely explain the stability of US hours worked as the exception it is. Moreover, most of these mechanisms are unlikely to continue to exert an upward influence on hours in future.
What other implications are there from our interpretation of the historical data? Low hours worked, and low employment, do go hand in hand with high income, and are thus a sign of well-being as opposed to malfunction. Thus, though various distortions may induce lower hours worked than desirable, the fundamental force toward working less should be appreciated and taken into account in welfare evaluations across countries as well as over time.
Our interpretation of the time-series and cross-country data also implies that one should expect inequality of hours worked across households within a given country. In particular, less wealth and lower wages per hour would, ceteris paribus, suggest a higher desired amount of work. Thus, higher work efforts for lower-income groups within any country are a natural market outcome and systematic departures from such patterns could indicate inefficiencies. This means that policies or broad agreements in the labour market aimed at restricting hours worked ought to take this heterogeneity into account.
Our view should not be taken to mean that growth in labour productivity has been, is, or will be the same for all workers. What technology will bring in the future will surely not affect all ‘skills’, whether acquired or hard-wired, the same way – some workers will see their wages rise in relative terms and others will see theirs fall. But to the extent that there are broad and steady productivity gains in the future mirroring those of the longer history of economic growth, we feel confident in predicting that working hours will continue to decline at a steady rate, and that this would be a good thing!
References
Boppart, T and P Krusell (2016) “Labor supply in the past, present, and future: A balanced-growth perspective”, CEPR Discussion Paper No 11235.
Cooley, T F and E C Prescott (1995) “Economic growth and business cycles”, Frontiers of business cycle research, 39: 64.
The Economist (2014) “The onrushing wave”, 18th January.
King, R G, C I Plosser and S T Rebelo (1988) “Production, growth and business cycles: I. The basic neoclassical model”, Journal of Monetary Economics, 21(2-3): 195--232.
Maddison, A (2001) “The world economy: A millennial perspective”, Volume 1, OECD, Development Centre Studies.
Ramey, V A and N Francis (2009) “A century of work and leisure”, American Economic Journal: Macroeconomics, 1(2): 189--224.
Rogerson, R (2006) “Understanding differences in hours worked”, Review of Economic Dynamics, 9(3): 365-409.
Endnotes
[1] For a comprehensive survey, see the Economist from 18th January 2014.
[2] King et al. (1988) show how to model this phenomenon.
