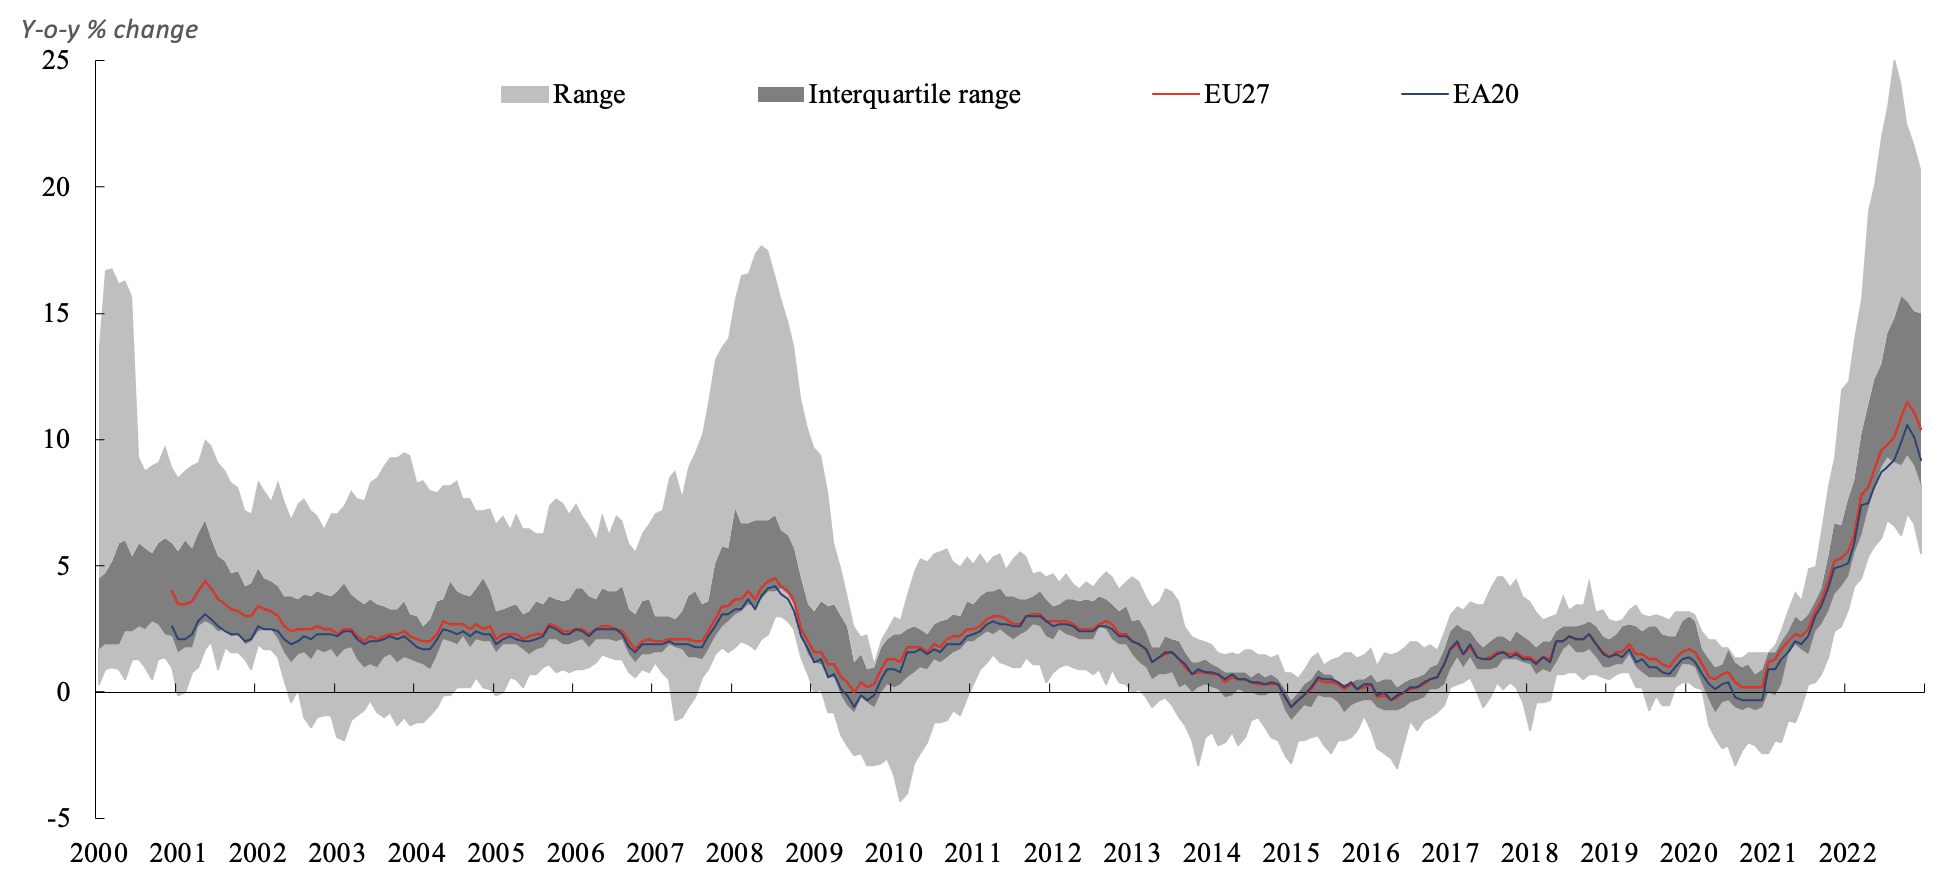
The succession of large shocks that have hit the euro area and the EU, along with other advanced economies, in the early 2020s induced a surge in inflation across member states. Inflation started rising with the recovery from the COVID-19 crisis, and then accelerated substantially with the Russian invasion of Ukraine. The increase in headline inflation in 2022 was primarily driven by the historically large increase in the price of energy and food along with supply bottlenecks and post-pandemic reopening effects (European Commission 2022), but even before COVID-19 there was strong evidence that inflation movements were driven by common shocks. The sharp discrepancies in inflation rates across the euro area went less noticed at first, but in 2022 inflation differentials reached historically high levels (Figure 1) and inflation rate dispersion (as measured by the interquartile range) spiked, for both headline inflation and core (headline excluding energy and food) inflation albeit at different levels.
Figure 1 Harmonised index of consumer prices (HICP) inflation differentials in the euro area, 2000-2022
Note: The inter-quantile range is the difference between the 75th and 25th percentile of the cross-country distribution, with the euro area in changing composition. The range corresponds to the lowest/highest inflation growth rate across the euro area countries in each month. The latest observations are for December 2022.
Source: Eurostat, own calculations.
Some degree of inflation differentials within the euro area may be viewed as normal if they are part of an adjustment process or associated with catching up processes. Since it is not possible to respond to asymmetric shocks through a change in monetary policy or the bilateral nominal exchange rate, adjustments are likely to take place through changes in real effective exchange rates, i.e. through inflation differentials. When persistent, inflation differentials can create several problems. First, in a monetary union, large and lasting differences in inflation rates complicate the conduct of monetary policy. Secondly, if spells of high inflation would lead to de-anchoring of inflation expectations and strong second round effects, the inflation rate could remain at high levels for longer, compounding the task of the ECB to tame it. Lastly, there are several concerns that the surge in energy prices during 2022 could result in lasting price competitiveness losses in some euro area countries.
Drivers of inflation differentials
Differences in inflation across countries can be due to several factors. Honohan and Lane (2003) find a positive and statistically significant relationship between inflation differential and business cycle differences (as measured by the output gap) in the euro area. Different economic structures can lead both to a higher exposure to asymmetric shocks or to differences in the responses to common shocks, such as changes in energy prices or in the euro nominal exchange rate (Beck et al. 2009). Inflation differentials across countries might therefore result from different responses to common shocks (Borio and Filardo 2007). Differences in the costs of local production and distribution, including wages, could also be a source of inflation differentials (Beck et al. 2009). In the case of energy costs, for instance, differences in market structures may have played an especially important role in 2022 as the pass-through from energy commodity to retail electricity and gas prices varied across the EU, reflecting differences in national energy markets (Hernnäs et al. 2023). Theory also suggests that inflation expectations play an important role in actual price setting. As regards the 2022 inflation episode, long-term inflation expectations have remained well-anchored despite the large increase in inflation and the heightened attention to inflation (Buelens 2023). Finally, inflation differentials might result from the medium-term process of convergence. Since convergence is a slow process, this type of inflation differentials should be persistent and their impact on inflation differences across countries has turned out low (Honohan and Lane 2003).
Common shocks with different impact
We investigate determinants of inflation differentials in the euro area with particular focus on the asymmetric response to a common shock. We use panel regressions to assess whether structural/cyclical factors can explain how common shocks reverberate across member states and hence drive inflation differentials. We estimate a relationship between the country- and time—specific inflation rate and a set of explanatory variables in a panel regression setting. The common drivers of inflation are controlled for via the inclusion of a common factor, extracted from principal component analysis, allowing for heterogeneity in the responses to this factor via interactions with country-specific characteristics. This approach allows to explain inflation differentials coming from idiosyncratic national movements and from heterogeneous responses to the common factor, while being agnostic about the sources of common shocks, which may have been many. It extends previous literature (Honohan and Lane 2003, Beck et al. 2009) by including a common factor in the model and testing heterogeneity in the response to this factor using interactions.
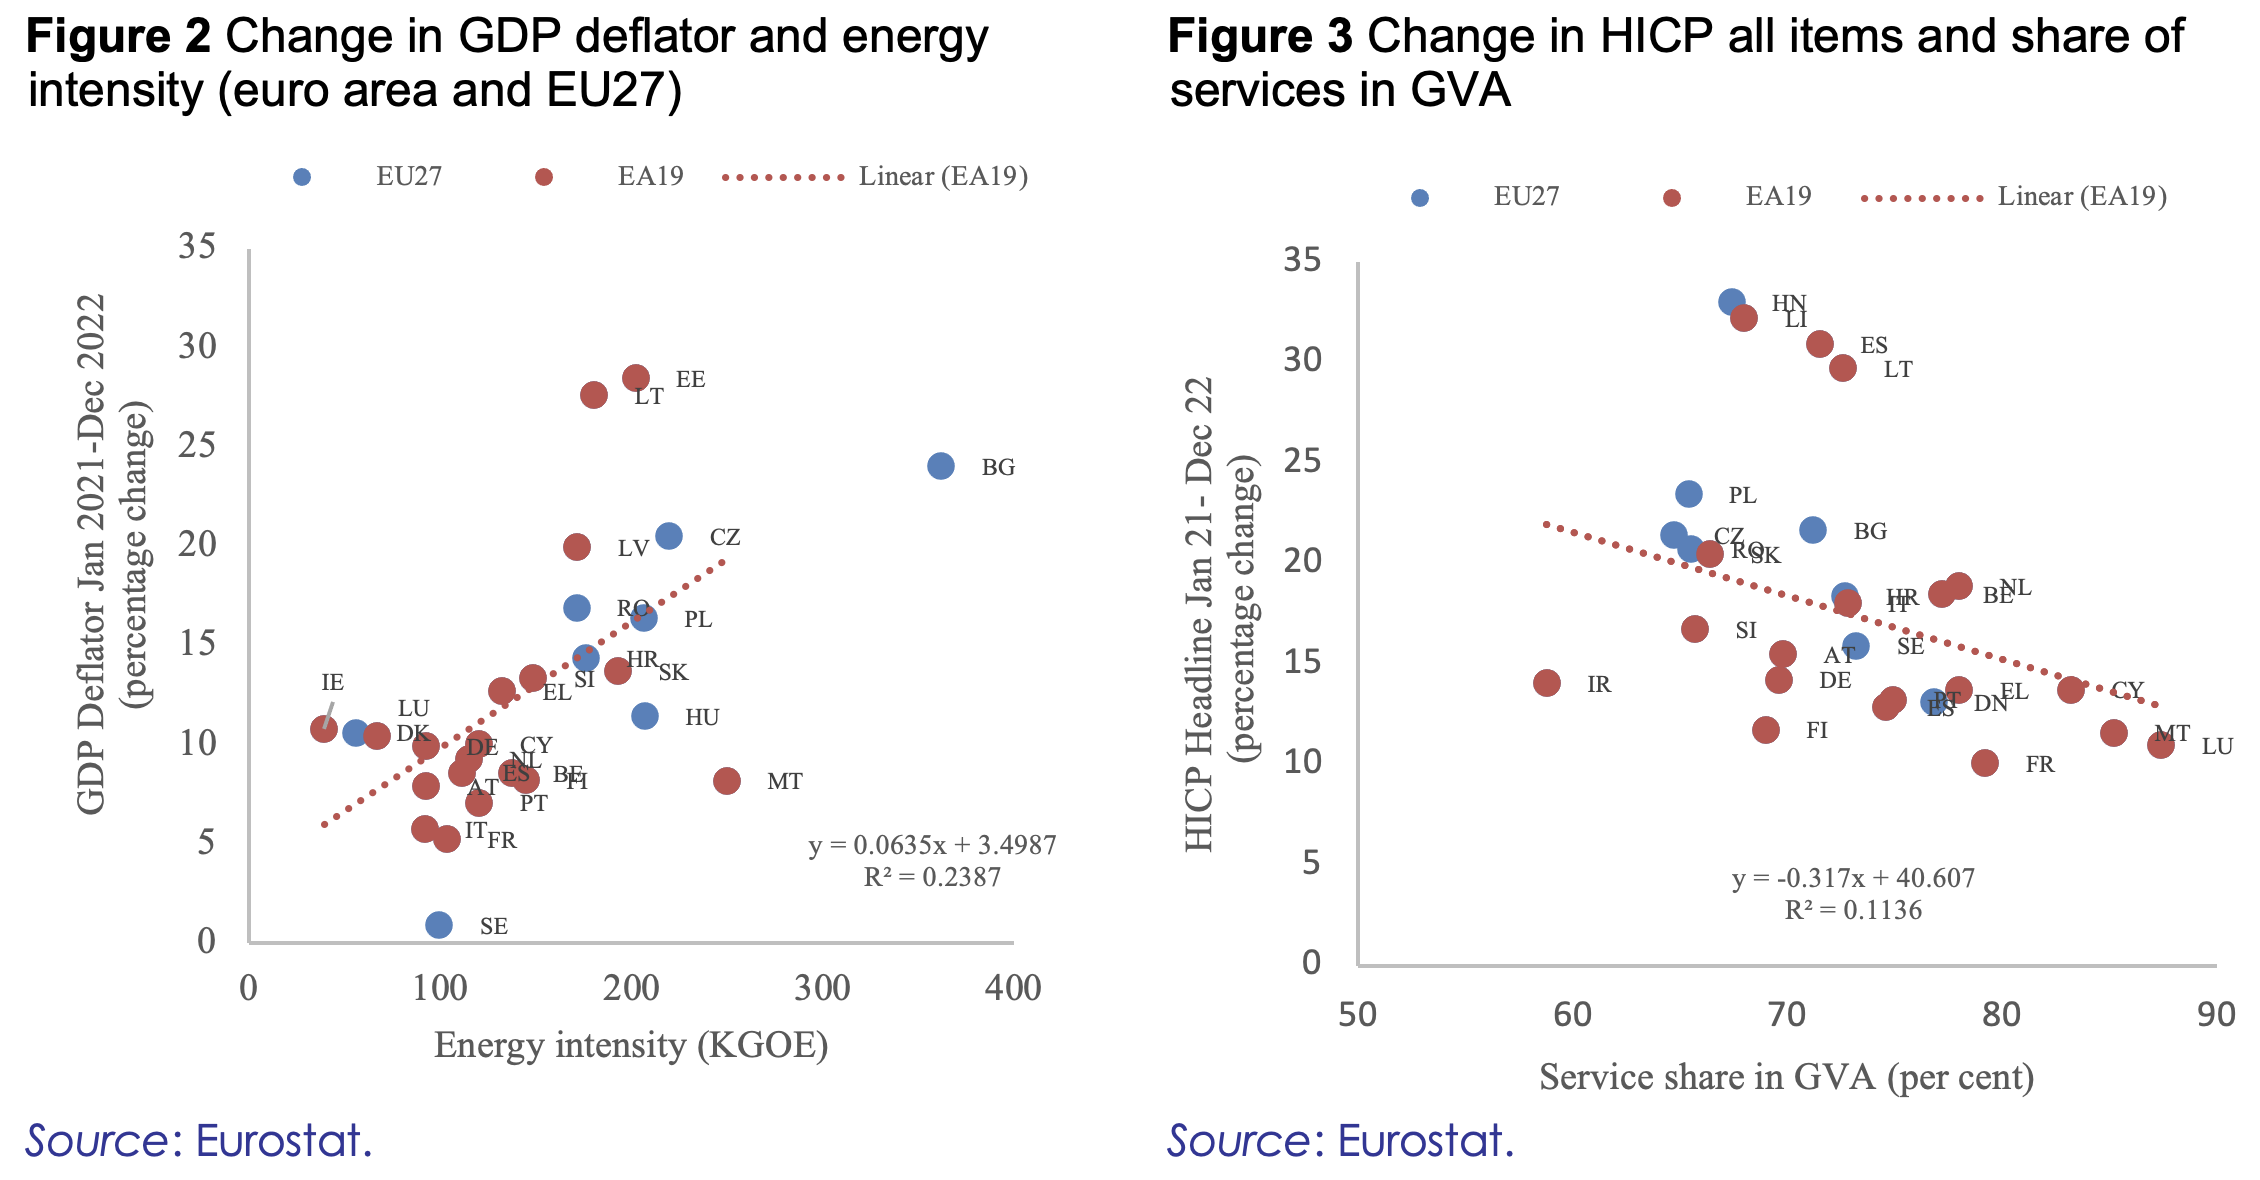
With reference to the recent inflation surge, countries with large energy intensity and with a larger manufacturing sector experienced a larger inflation shock when this is measured as both the change in the Harmonised Index of Consumer Prices (HICP) all item index and the GDP deflator (Figure 2) that reflects domestic price determinants, wages and costs, with direct links with the structure of the economy. The correlation of energy inflation with core and food inflation is generally low in normal times. However, it has been significant in 2022, because of the exceptional increase in energy prices. The price pressures originated in the energy wholesale market (Tertre et al. 2023) have been transmitted along the production chain affecting price of non-energy items such as food, goods, and services. Sectoral specialisation can contribute also to explain the heterogenous increase in inflation in the euro area and the EU, with headline inflation increasing less in countries with a larger share of gross value added (GVA) in services (Figure 3). The service sector tends to be less volatile and to a smaller extent driven by common shocks and less exposed to international competition than manufacturing.
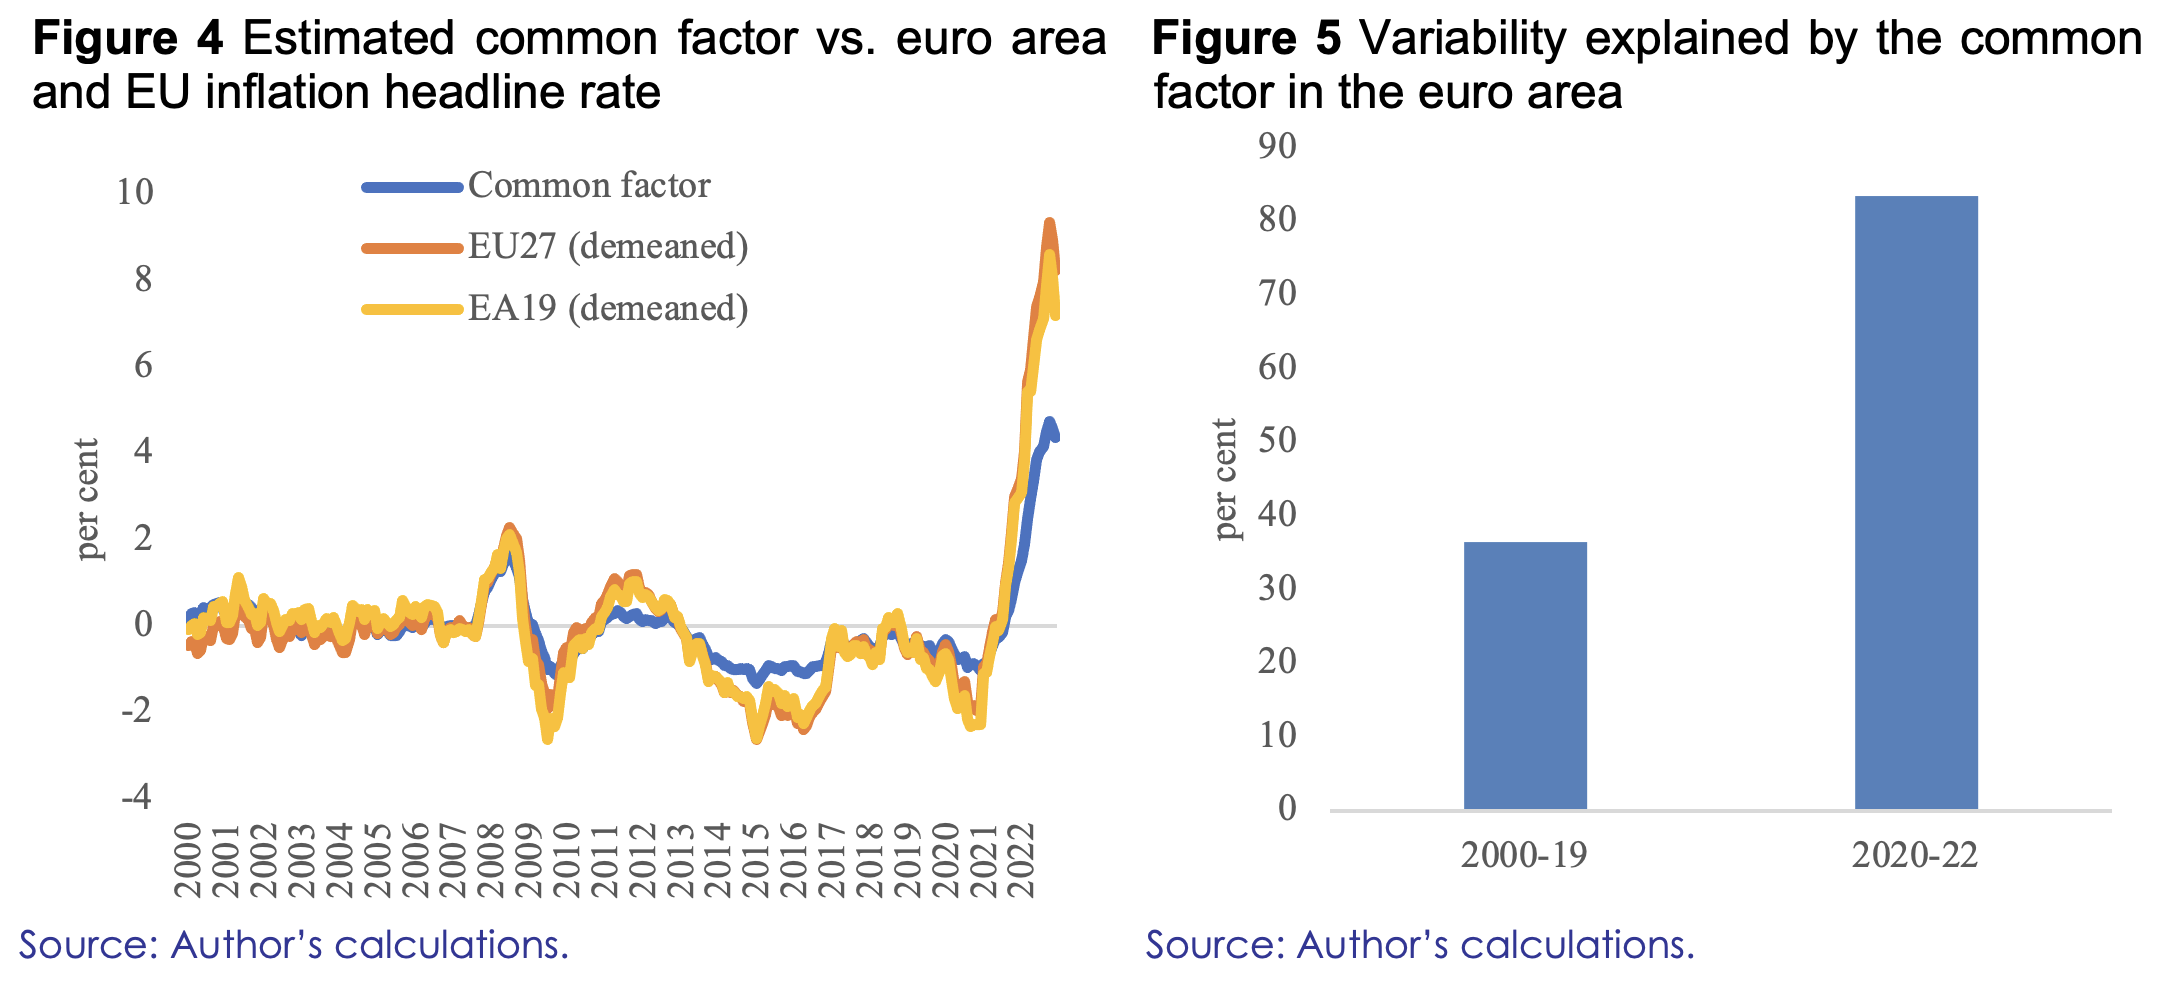
Principal component analysis is used to identify a common factor in the euro area and EU countries’ inflation rates. The estimated common factor affecting EU HICP inflation tracks euro area HICP inflation relatively well (Figure 4), suggesting that a large share of inflation is driven by common factors. The share of inflation variability explained by the estimated common factor is about 53% (more than the commonly used threshold of 40%). The estimated common factor correlates well with a set of global variables, including international oil and gas prices. Since the COVID-19 crisis in 2020-22, the common factor explains more of the variance for the euro area inflation rate (Figure 5) than in previous periods (around 80% between 2020-22) suggesting a more prominent role for the common component in this period.
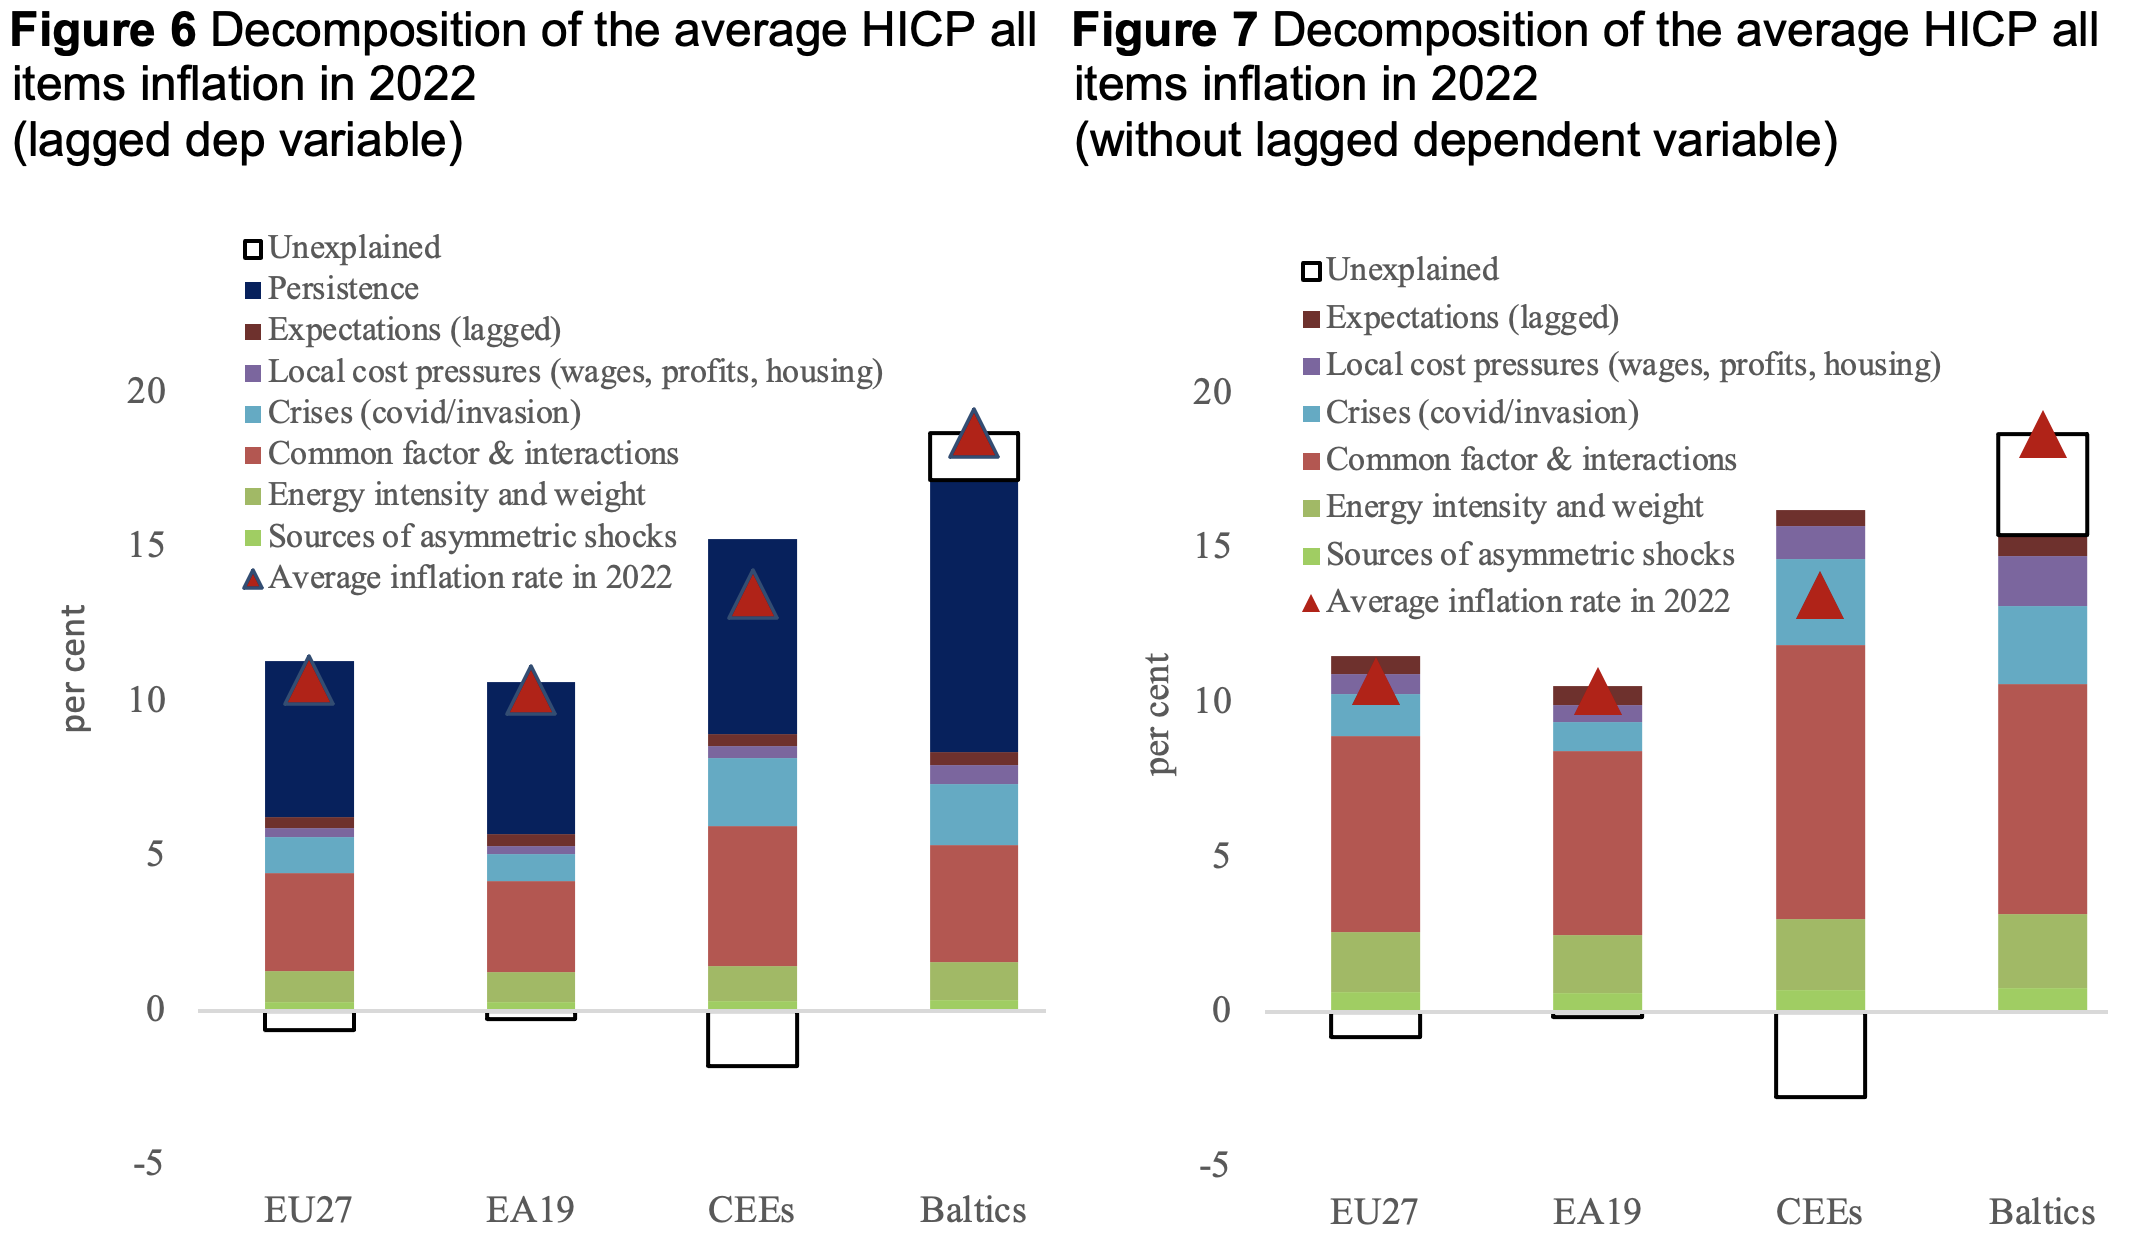
The panel regression analysis focus on the euro area sample and it uses headline inflation as measured by the HICP All item index as a dependent variable in the main scenario. The advantage of restricting the regression sample to euro area countries is to limit the endogeneity concerns of using a common factor estimated with inflation series for all EU27 countries, but the model coefficients are relatively robust to extending the sample to all 27 EU countries. One limitation of using headline inflation is that this measure is influenced by discretionary fiscal policy such as temporary tax changes (for example Germany value-added tax cuts reduced inflation in the second half of 2020) and gas and electricity price caps in response to high energy prices in 2022. However, our results are robust under alternative definitions of the dependent variable including the HICP index excluding energy and food and using the GDP deflator that is less influenced by external price pressures. A decomposition of the drivers of average headline inflation rate in 2022, using the estimated model, is provided in Figures 6 and 7 for the EU27, EA19, a subset of Central and Eastern European Economies, and the Baltic States, which are the largest contributors to the differentials in the 2022 inflation episode.
First, when estimated with the lagged dependent variable, the impact of a common shock – mostly related to the increase in energy and food prices – can explain around half of the increase in the euro area headline inflation in 2022 (Figure 6). The estimated responses to the common factor increase with energy intensity, reflecting the role of energy prices in driving global shocks to inflation, and decline with the share of services in GVA, suggesting that countries with a larger manufacturing sector have been more sensitive to common factors. The remainder of inflation developments can be explained by inflation persistence (as measured by the lagged dependent variable), along with more local and crisis-related factors. This persistence might be related to the relatively long pass-through for the energy shock and the staggered nature of contracts in the euro area.
Second, when estimated without the lagged dependent variable (Figure 7), controlling for residual autocorrelation, our results suggest that common factors can account for up to two-thirds of the increase in inflation in 2022 while the contribution of local drivers remains limited. The contribution of unit labour costs (ULC) and other local factors is captured to some extent by the lagged dependent variable. Indeed, when we estimate the model without lagged dependent variable the contribution of unit labour costs and other local factors increases somewhat.
Note: In the figure the Central and Eastern European (CEEs) subsample includes: Bulgaria, Czechia, Poland, Hungary, and Romania. The Baltics subsample covers: Estonia, Latvia, and Lithuania. Figure 6 is based on equation 7 in Table 1 of the paper that includes the lagged dependent variable. Figure 7 is based on equation 4 in Table 1 of the paper that excludes the lagged dependent variable. The variables used in Figure 6 are grouped as follows. Sources of asymmetric shocks contribution include the contribution of the unemployment, the nominal effective exchange rate (NEER) and the share of service in GVA; the common factor & interactions contribution includes the combined effect of the common factor and interactions; the energy intensity and weights contribution combines the effects from energy intensity (not interacted), and energy weights in HICP; the local cost pressures (wages, profits, housing) contributions combines the effects of the costs of wages, profits, and housing; crises contribution captures the effect of the stringency index and the Russia invasion dummy (which accounts for gas imports from Russia); persistence reflects the contribution from the lagged dependent variable; expectations includes the contributions from consumer price expectation; and unexplained. The same set of variables with the exclusion of the lagged dependent variable are used in Figure 7.
Source: Coutinho and Licchetta (2023).
Conclusion and policy implications
We find that inflation differentials in the euro area in 2022 can be accounted for, to a significant extent, by asymmetric responses to a common factor, particularly if we take into account that persistence is likely associated with a relatively long pass-through for the energy shock, related to the staggered nature of supply contracts and price setting in the euro area. In principle, this should raise less concern from a policy perspective, unless the differences in economic structures are driven by distortions and are not sustainable. If the differentials are linked to the energy terms of trade shock, inflation differentials could be a sign that the adjustment is taking place and have a limited impact on policy. On the back of a substantial drop in energy prices at the beginning of 2023, inflation differentials started to narrow. This provides further support to the idea that the increase in headline inflation in 2022 was primarily driven by a large common, but asymmetric, shock related to the historically large increase in energy and other commodity prices. On the policy side, the central message of this paper is consistent with the need to enhance the supply side of the economy by reducing energy dependence, production costs, and increase potential output, thereby mitigating inflationary pressures.
Authors’ note: This column is based on European Economy Discussion Paper No 197: Publications Office of the European Union, 2023. The views expressed in this document are solely those of the author(s) and do not necessarily represent the official views of the European Commission.
References
Beck, G, W K Hubrich and M Marcellino (2009), “Regional inflation dynamics within and across euro area countries and a comparison with the United States”, Economic Policy 24(57): 142-184.
Borio, C and A Filardo (2007), “Globalisation and inflation: New Cross Country Evidence on the Global Determinants of Global Inflation”, BIS Working Paper No. 227.
Borio, C, M Lombardi, J Yetman and E Zakrajšek (2023), “The two-regime view of inflation”, BIS Papers 133.
Buelens, C (2023), “The great dispersion: euro area inflation differentials in the aftermath of the pandemic and the war”, Quarterly Report of the Euro Area (QREA) Volume 22, Issue 2.
Coutinho, L and M Licchetta (2023), “Inflation Differentials in the Euro Area at the Time of High Energy Prices”, European Economy Discussion Papers 197.
European Commission (2022), “European Economic Forecast – Autumn 2022”, European Commission.
Hernnäs, H, Å Johannesson-Lindén, R Kasdorp and M Spooner (2023), “Pass-through in EU electricity and gas markets”, Quarterly Report of the Euro Area (QREA) Volume 22, Issue 2.
Honohan, P and P R Lane (2003), “Divergent inflation rates in EMU”, Economic Policy 18(37): 357-394.
Tertre, M G, I Martinez and M R Rábago (2023), “Reasons behind the 2022 energy price increases and prospects for next year”, VoxEU.org, 2 July.
